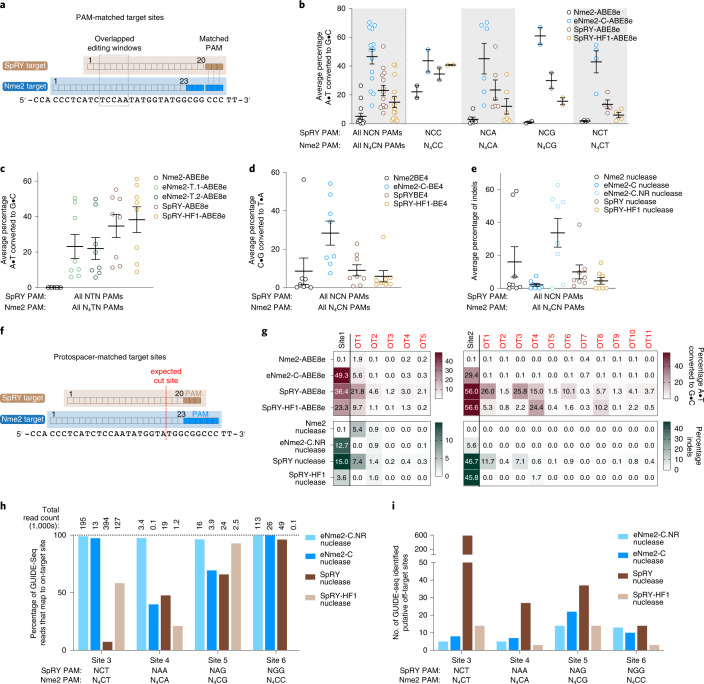
Fig. 3. Characterization of evolved Nme2Cas9 variants in mammalian cells.
a, Overview of PAM-matched sites used to compare eNme2Cas9 variants to SpRY and SpRY-HF1. b, Summary dot plots showing the activity of eNme2-C-ABE8e compared to SpRY-ABE8e and SpRY-HF1-ABE8e at 14 PAM-matched NCN/N4CN sites in HEK293T cells. Left-most data represent a summary of all 14 sites, and subsequent columns represent a subdivision into specific PAMs. c, Summary dot plots showing the activity of eNme2-T.1-ABE8e and eNme2-T.2-ABE8e compared to SpRY-ABE8e and SpRY-HF1-ABE8e at eight PAM-matched NTN/N4TN sites in HEK293T cells. d, Summary dot plots showing the activity of eNme2-C-BE4 compared to SpRY-BE4 and SpRY-HF1-BE4 at eight PAM-matched NCN/N4CN sites in HEK293T cells. e, Summary dot plots showing the activity of eNme2-C nuclease and eNme2-C.NR nuclease compared to SpRY nuclease and SpRY-HF1 nuclease at eight PAM-matched NCN/N4CN sites in HEK293T cells. f, Overview of protospacer-matched sites used to compare the DNA specificity of eNme2Cas9 variants against SpRY and SpRY-HF1. g, Heat maps showing off-target adenine base editing activity (brown) or off-target indel formation (dark green) at computationally determined off-targets for two sites in HEK293T cells for eNme2-C-ABE8e and eNme2-C.NR nuclease compared to SpRY and SpRY-HF1 adenine base editor and nuclease variants. The left-most column represents on-target activity. Values represent the average of n = 3 independent biological replicates. h, Percentage of on-target GUIDE-seq reads identified at four protospacer-matched sites for eNme2-C nuclease, eNme2-C.NR nuclease, SpRY nuclease and SpRY-HF1 nuclease. Total reads for the given nuclease are listed above each bar. i, Total putative off-target sites identified by GUIDE-seq for eNme2-C nuclease, eNme2-C.NR nuclease, SpRY nuclease and SpRY-HF1 nuclease at four protospacer-matched sites. For b–e, each point represents the average editing of n = 3 independent biological replicates measured at the maximally edited position within each given genomic site. Mean ± s.e.m. is shown and reflects the average activity and standard error of the pooled genomic site averages.

