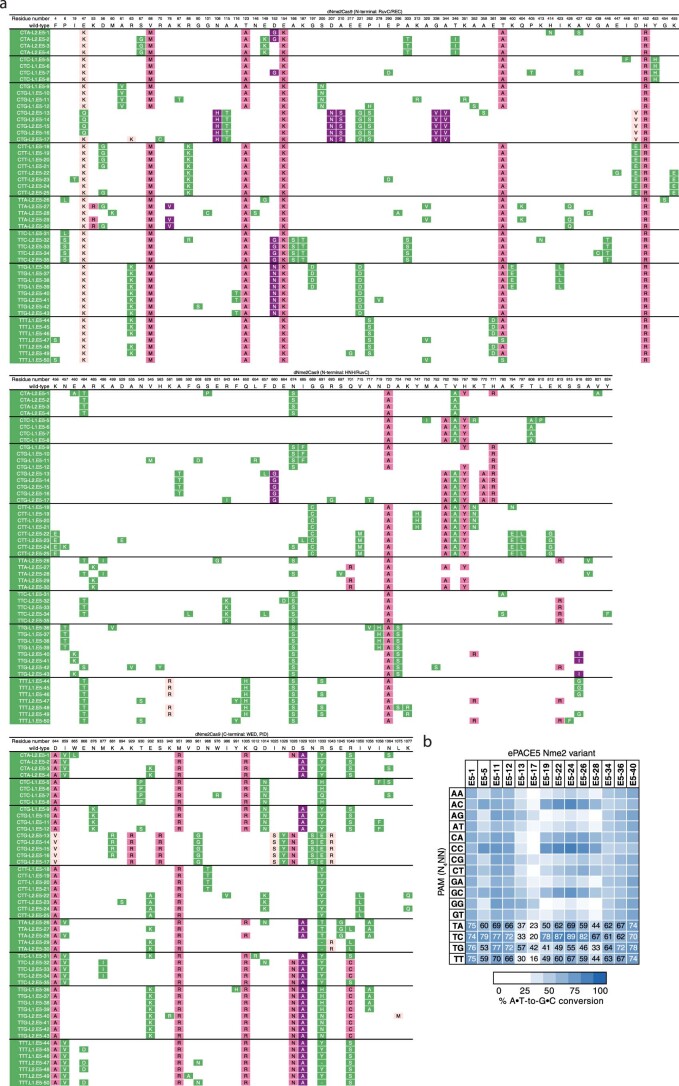
Extended Data Fig. 5. Mutation table and representative activity of ePACE5-evolved Nme2Cas9 variants.
(a) Genotypes of individually sequenced plaques following ePACE5, with positions varying from wild-type displayed. Clones evolved on different PAMs are delineated by a bold line. Mutations that had previously appeared in ePACE1, ePACE2, or ePACE3 are shown in light pink, magenta, or purple, respectively, while novel mutations are shown in green. Positions that were unable to be called due to low sequencing quality are denoted by a “-“. (b) Heat map showing ABE-PPA activity of representative clones from ePACE5 on the 16 combinations of PAM positions 5 and 6 (N4NN) Values are raw % A•T-to-G•C conversion observed for one replicate of each editor and are listed in each cell for the N4TN PAMs, with values above 70% A•T-to-G•C conversion colored white.

