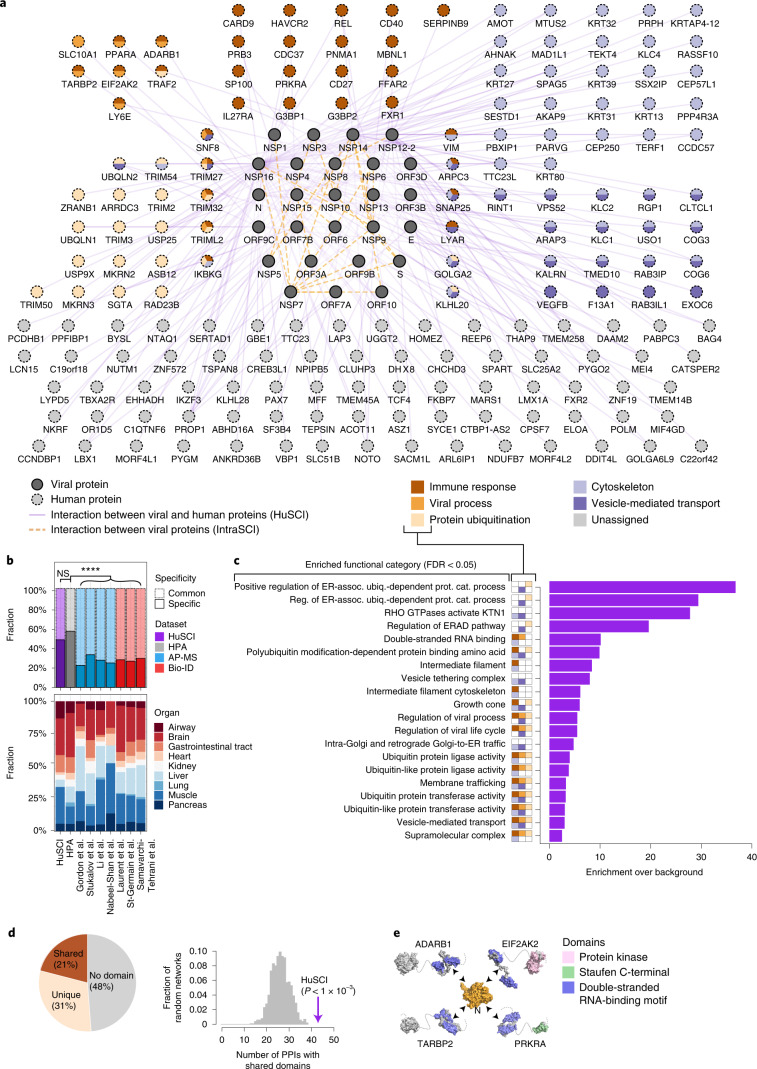
Fig. 2. Network representation and functional assessment of HuSCI.
a, Combined HuSCI and IntraSCI networks. Node colors of human proteins represent broad enriched functions as indicated in legend. Node labels for human proteins correspond to approved HGNC symbols; accession identifiers and descriptions are listed in Supplementary Table 1. b, Proportion of host targets in common and specific expression groups in all (top) and in SARS-CoV-2 RNA-positive organs (bottom) across eight datasets: purple, HuSCI; gray, HPA21; blue, AP-MS datasets from Gordon et al.12,13, Stukalov et al.9, Li et al.14 and Nabeel-Shah et al.15; red, BioID datasets from Laurent et al.16, St-Germain et al.17 and Samavarchi-Tehrani et al.18. Two-sided Fisher’s exact test, Bonferroni adjusted P < 0.0001. Full statistical details and exact P values are listed in Supplementary Table 4. c, Functions enriched among host proteins found in HuSCI (P = 0.05, Fisher’s exact test with FDR correction). Broad functional groups are indicated in small boxes according to legend in panel a. Full statistical details are listed in Supplementary Table 5. ER-assoc. ubiq.-dependent prot. cat., Endoplasmic reticulum-associated ubiquitin-dependent protein catabolic. d, Proportion of virus–host interactions in which the human protein has domains that are present in other interactors of the viral protein (shared), not present in other interactors of the viral protein (unique) or no annotated domains (left) and number of shared-domain interactions in HuSCI (arrow) compared to n = 1,000 randomized control networks (gray distribution) (right). One-sided empirical P < 0.001. PPI, protein-protein interactions. e, Exemplary ‘shared-domain interaction’ between the viral nucleocapsid protein and four interactors containing a double-stranded RNA-binding motif. Domain colors according to legend; gray parts lack domain annotations.

