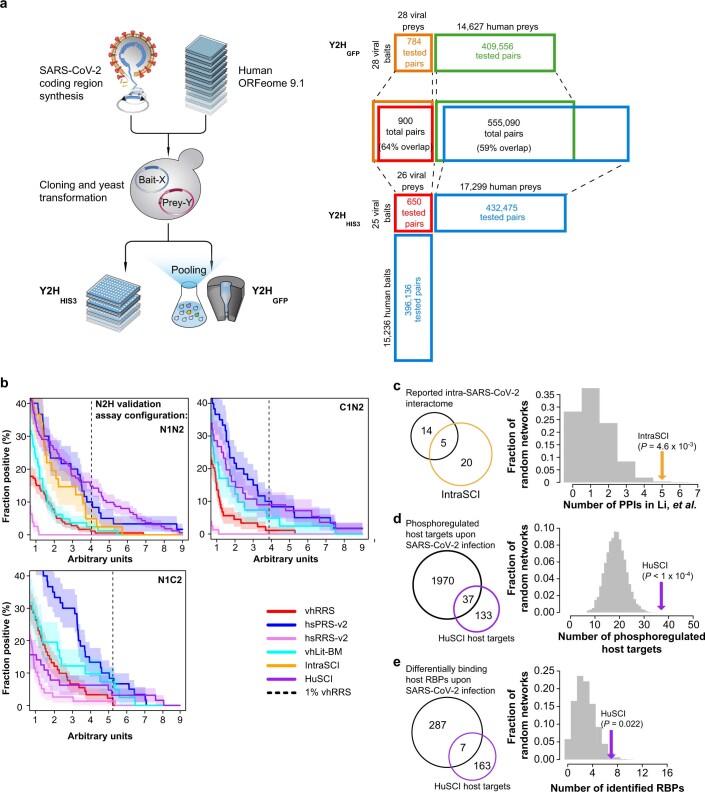
Extended Data Fig. 1. Screening space, orthogonal validation and comparison of HuSCI and IntraSCI to previous SARS-CoV-2 related datasets.
a, Schematic of the experimental contactome mapping pipelines (left) and screening space for each of the two parallel Y2HHIS and Y2HGFP screens (right). Proportional overlap is given relative to the union of protein pairs tested by both methods. b, Rate at which interactions are detected by yN2H for HuSCI and IntraSCI, as well as positive (hsPRS-v2 and vhLit-BM) and negative (hsRRS-v2 and vhRRS) benchmark sets, across stringency thresholds, error band: standard error of proportion. c, Left: overlap of previously identified intraviral SARS-CoV-2 interactions and IntraSCI; right: actual overlap (arrow) compared to n = 10,000 randomized control networks. One-sided, empirical P = 0.0046. d, Left: overlap of host targets identified in HuSCI and differentially phosphorylated proteins following infection by SARS-CoV-2; right: actual overlap (arrow) compared to n = 10,000 randomized control networks. One-sided, empirical P < 0.0001. e, Left: overlap of host targets identified in HuSCI and RNA Binding Proteins (RBPs) demonstrating differential RNA binding upon SARS-CoV-2 infection; right: actual overlap (arrow) compared to n = 10,000 randomized control networks. One-sided, empirical P = 0.022.

