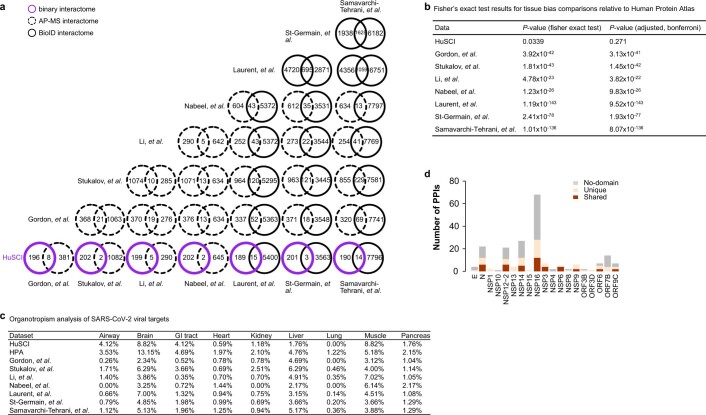
Extended Data Fig. 2. Comparison of HuSCI with SARS-CoV-2 association and proximity datasets.
a, Overlap of viral-human protein pairs between HuSCI, four AP-MS and three BioID based datasets (Gordon et al.12,13, Stukalov et al.9, Li et al.14, Nabeel-Shah et al.15, Laurent et al.16, St-Germain et al.17, Samavarchi-Tehrani et al.18). b, Statistical analysis of representation of host targets in common and specific expression groups from datasets in (a), compared to the Human Protein Atlas22 (HPA) (Fisher’s exact test with Bonferroni correction). c, Organotropism analysis across SARS-CoV-2 infected organs from datasets in (b). The percentage of genes within each dataset with specific organotropism (‘tissue-specific’ expression in tissues grouped into organ systems). b and c, Full analysis is shown in Supplementary Table 4. d, Proportion of HuSCI host interactors per SARS-CoV-2 protein in which the human protein has: domains present in other interactors of the viral protein (shared); domains not present in other interactors of the viral protein (unique); no structural domains. Full analysis is shown in Supplementary Table 6.

