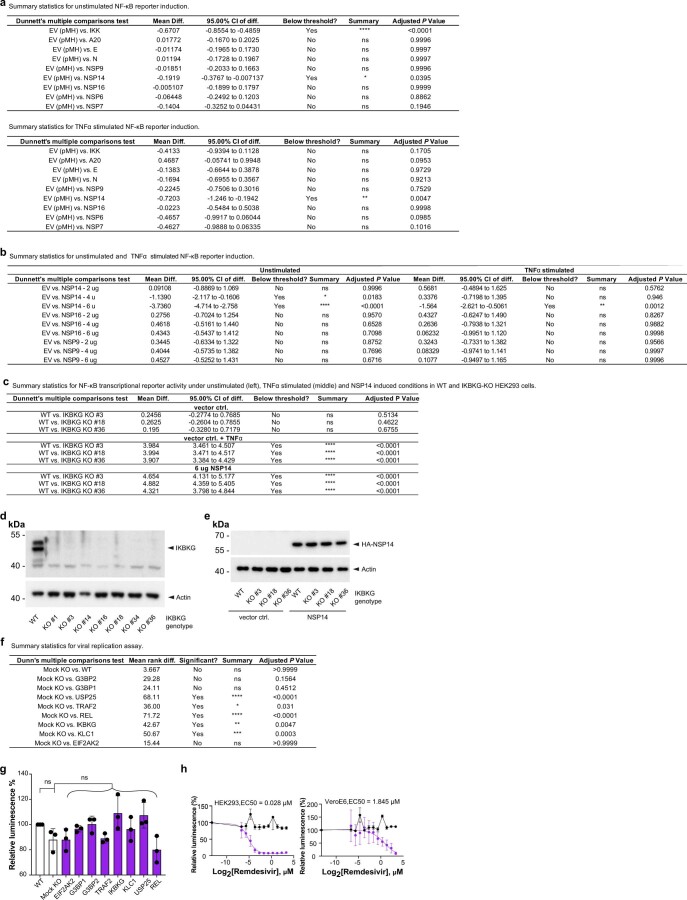
Extended Data Fig. 4. Effect of viral proteins on NF-κB reporter activity and of viral interactors on viral replication.
a, Tables showing statistical details of NF-κB transcriptional reporter activity in the absence and presence of selected viral proteins under unstimulated (top) and TNFα stimulated (bottom) conditions. One-way ANOVA with Dunnett’s multiple comparisons test, n = 3, adjusted P values are shown. b, Table showing statistical details of NF-κB transcriptional reporter activity at different amounts of transfected viral protein-encoded plasmid under unstimulated (left) and TNFα stimulated conditions (right). One-way ANOVA with Dunnett’s multiple comparisons test, n = 3 and n = 6, respectively, adjusted P values are shown. a and b, Raw data and full analysis is shown in Supplementary Table 9. c, Table showing statistical details of NF-κB transcriptional reporter activity under unstimulated (left), TNFα-stimulated (middle) and NSP14-induced conditions in WT and IKBKG KO HEK293 cells (two-way ANOVA with Dunnett’s multiple comparisons test, n = 3), adjusted P values are shown. d, Representative anti-IKBKG (top) western blot demonstrating levels of IKBKG in WT and three independent IKBKG knockout clones of HEK293 cells relative to actin beta (ACTB) loading controls (bottom). e, Representative anti-hemagglutinin (HA) western blot demonstrating levels of tagged NSP14 protein in NF-κB induction experiments relative to actin beta (ACTB) loading controls (bottom). f, Table showing statistical details of viral replication in wild-type, mock KO and CRISPR KOs of the indicated HuSCI host proteins. Kruskal-Wallis with Dunn’s multiple comparisons test, n = 9. Adjusted P values are shown. g, Cell viability of mock KO and CRISPR KOs of the indicated HuSCI host proteins relative to WT cells. Kruskal-Wallis with Dunn’s multiple comparisons test, n = 3. Adjusted, Fisher’s exact P values are shown. f and g, Raw data, Fisher’s exact P values, and full analysis is shown in Supplementary Table 10. h, Cell viability and relative replication of icSARS-CoV-2-nanoluciferase in HEK293 cells (left) and Vero E6 cells (right) at different concentrations of remdesivir. The EC50 values shown for each cell line were calculated with a variable slope model. Error bars: standard deviation of the mean, n = 3 biological repeats, full analysis in Supplementary Table 11.

