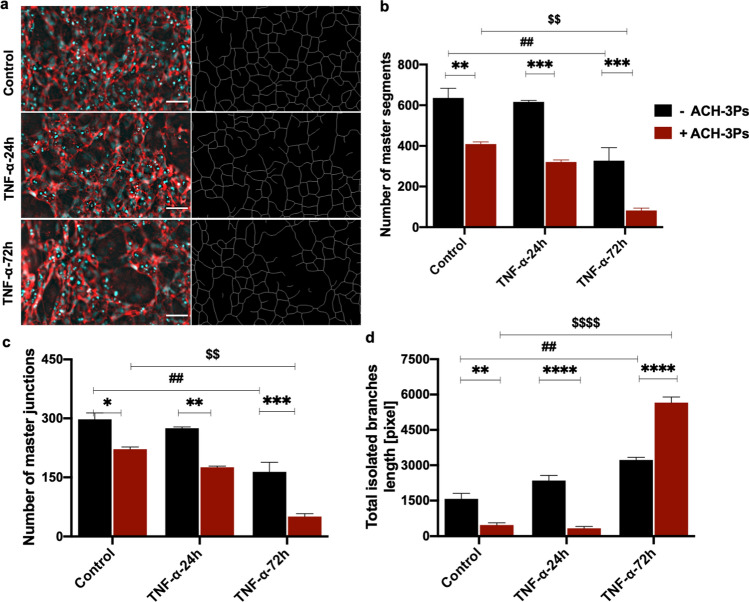
Fig. 5.
Quantification of vascular network formation. a Representative immunofluorescent images of HUVECs in microfluidic devices under different TNF-α conditions, that were analyzed using the Angiogenesis Analyzer ImageJ macro and their corresponding map outputs. Scalebar represents 100 µm. The b number of master segments, c number of master junctions and d total isolated branches length of HUVECs with and without ACH-3Ps in the system. Data presented as mean ± SEM. Ordinary two-way ANOVA with Tukey post hoc test; n = 3; **p < 0.01, ***p < 0.001, ****p < 0.0001

