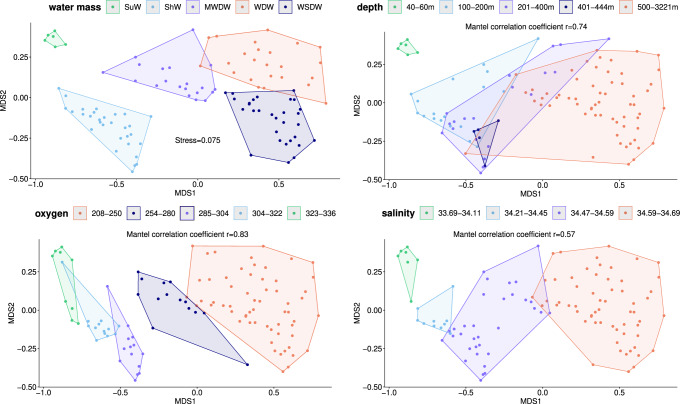
Fig. 2. Two-dimensional NMDS plots illustrating pairwise Bray-Curtis distances between pico-nano eukaryotic communities in the Western Weddell Sea.
All NMDS plots are identical (with a stress value = 0.075 shown in an upper left panel), but the samples are clustered in different ways as described below. The water masses are mapped on the NMDS plot in the upper left corner along with three most important abiotic variables (see the other three plots): depth, oxygen concentration, and salinity. Boundary points on gradients of those abiotic variables (where pico-nano eukaryotic community composition is significantly different across the boundary) were identified using a split moving-window analysis of ecological differentiation based on a Z-score cutoff of 1, and samples were clustered according to these boundary points. The clusters are colored and marked with polygons. The intervals of the abiotic variable corresponding to the clusters are shown in the legends on top of each plot. Mantel correlation coefficients (calculated for the matrix of Bray-Curtis distances between the pico-nano eukaryotic communities and for a matrix of Bray-Curtis distances between the samples based on an abiotic variable) are shown for each continuous variable. For similar mapping of the other environmental variables measured in this study see Suppl. Fig. 1. The source data underlying this figure see in Suppl. Data 1 and Suppl. Data 2.

