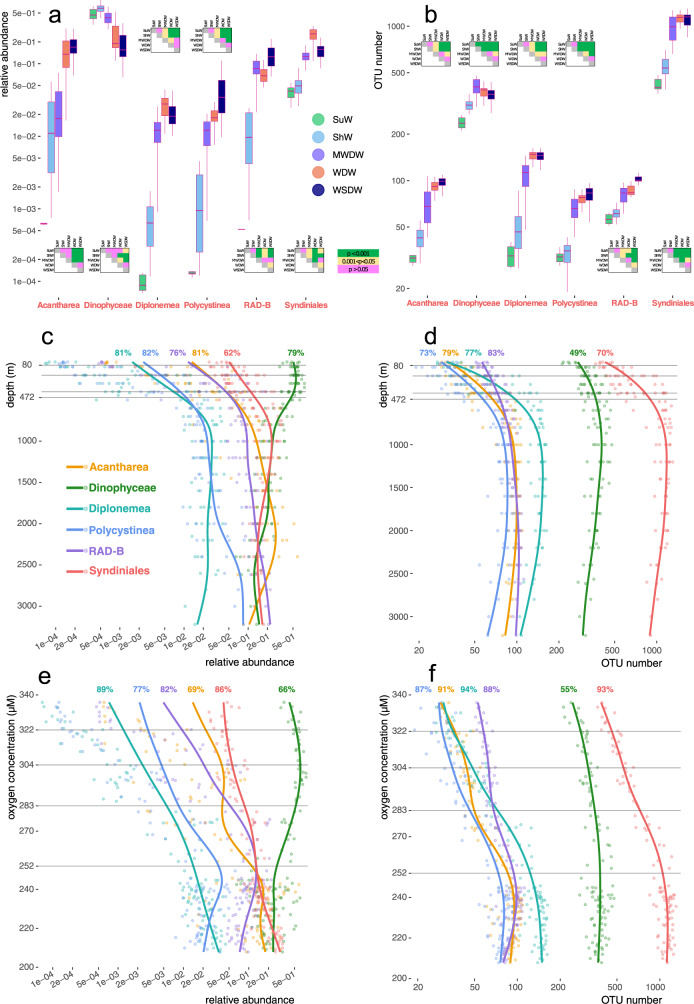
Fig. 4. Environmental distribution of six key players in the deep-sea eukaryotic community.
Relative abundance values and OTU counts for six taxonomic groups are shown across the five water masses sampled in this study, along with results of relevant dispersion analyses (panels a, b): either multiple ANOVA or the non-parametric Kruskal-Wallis test followed by post-hoc Dunn’s test, depending on a preceding test for normality (Suppl. Fig. 8). The statistical tests were applied to sample sets of the following sizes: 6 samples (Surface Water), 30 samples (Shelf Water), 20 samples (Modified Warm Deep Water), 24 samples (Warm Deep Water), 30 samples (Weddell Sea Deep Water). We also follow relative abundance or OTU richness of these six taxonomic groups along the depth (c, d) and oxygen concentration (e, f) gradients. The y-axis scales are logarithmic in panels (a) and (b), and the x-axis scales are logarithmic in panels (c), (d), (e), and (f). Similar results for all the 26 clades explored in this study are shown in Suppl. Figs. 5 and 6. Trend lines calculated using the GAM approach are shown, along with percentage of variance explained and individual data points. Depths and oxygen concentration values identified as ecological boundary points (Fig. 2) are marked with horizontal gray lines. The source data underlying this figure see in Suppl. Data 1.

