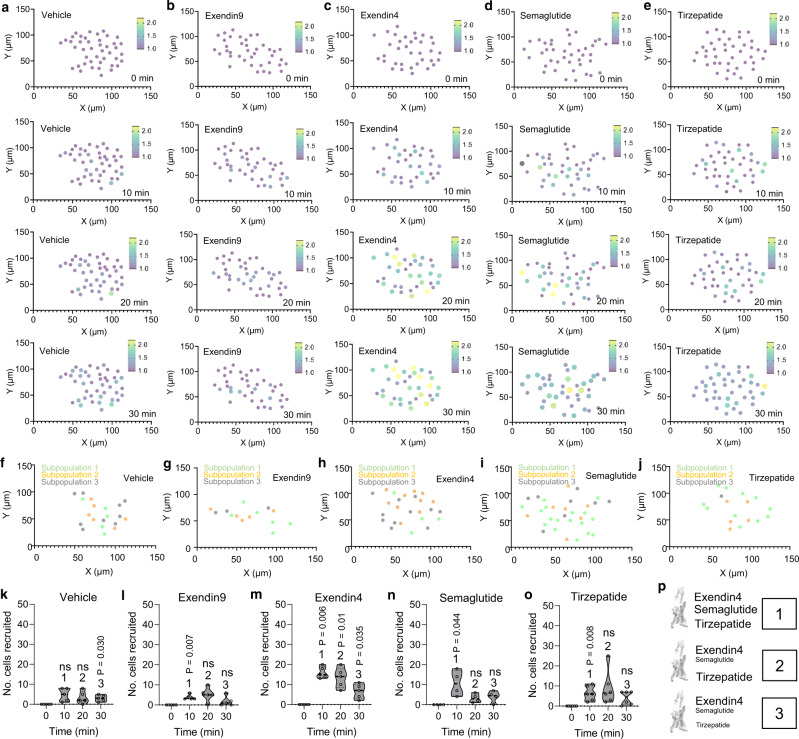
Fig. 6. GLP1R dynamics are heterogeneous.
a–e Cartesian (X-Y) maps for the islets in Fig. 5a showing cell position in the islet and changes in internalization strength over time following application of vehicle (a), or exendin9 (b), or stimulation with exendin4 (c), semaglutide (d) or tirzepatide (e) (representative plots from n = 4 islets, 3 animals). f–j Cartesian (X-Y) maps showing cell subpopulations recruited into internalization at 10 min (subpopulation 1), 20 min (subpopulation 2) and 30 min (subpopulation 3) post-stimulation with vehicle (f), exendin9 (g), exendin4 (h), semaglutide (i) or tirzepatide (j), for the islets shown in Fig. 5a and the graphs displayed in Fig. 5b–e. k–o Number of cells recruited into internalization at each time point following stimulation with vehicle (k), exendin9 (l), exendin4 (m), semaglutide (n) or tirzepatide (o) (one-way RM ANOVA with Dunnett’s or Bonferroni’s post-hoc test; vehicle: F = 2.97, DF = 3; exendin9: F = 6.39, DF = 3; exendin4: F = 16.60, DF = 3; semaglutide: F = 6.99, DF = 3; tirzepatide: F = 3.16, DF = 3) (n = 4 islets, 3 animals). p Schematic showing relative effects of the various agonists on trafficking within cell sub-populations 1, 2, and 3 (font size = strength of effect). **P < 0.05, **P < 0.01, NS, non-significant. Violin plots show median and interquartile range. Source data are provided as a Source Data file.

