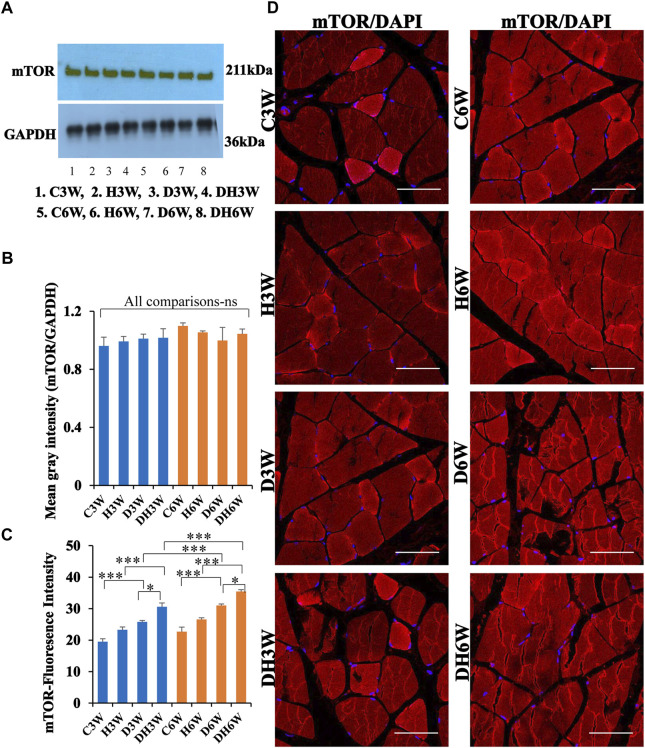
FIGURE 11.
(A,B)-Immunoblots probed with anti-mTOR antibody (A) and mean gray intensity of immunoblots. Note there is no significant difference in expression of mTOR between groups in short- and long-term experiments. Note significantly increased immunofluorescence of mTOR in D3W and D6W compared to C3W and C6W respectively. (C,D)-mTOR immunofluorescence intensity (C) and representative cross-section of muscle fibers stained for anti-mTOR immunofluorescence in short-term (left panel) and long-term (right panel) experiments (D). mTOR fluorescence was increased in DH3W and DH6W compared to D3W and D6W respectively. There was a significant increase in mTOR expression from short-term (D3W and DH3W) to long-term (D6W and DH6W). Note large number of muscle fibers showing immunofluorescence in D3W, DH3W, D6W, and DH6W. (*p < 0.05; ***, p < 0.001, One-way ANOVA, Bonferroni multiple comparison tests, n = 6 in all groups). Scale bar = 50 µm.

