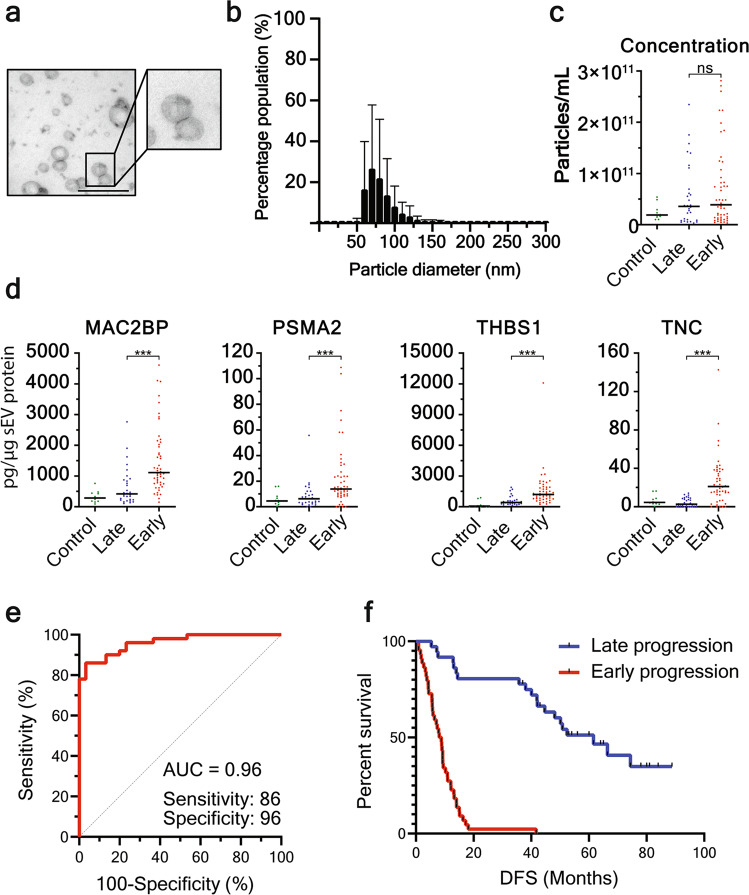
Fig. 4. Hypoxic sEV signature prognosticates disease progression in discovery NSCLC patient cohort.
a, b SEVs isolated from NSCLC plasma display typical morphology as shown by TEM (a, size bar 200 nm), and size distribution of 30–150 nm (b). c TRPS demonstrates that there is no difference in sEV concentration in plasma from healthy controls, patients that progress within 18 months (early) or patients without progression at 36 months (late). d The hypoxic sEV signature proteins are upregulated in sEVs derived from patients that progress within 18 months. e ROC curve demonstrates that the hypoxic sEV signature is an excellent prognostic marker of disease progression (<18 months) in NSCLC patients with a sensitivity of 86% and specificity of 96%. f Kaplan–Meier curve shows a clear separation of patient DFS based on the abundance of proteins from the hypoxic sEV signature. ***p < 0.001.

