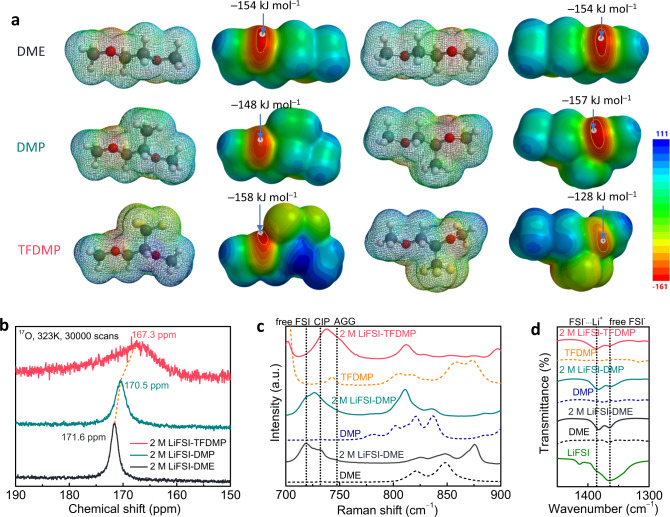
Fig. 3. Solvents and electrolyte solutions physicochemical characterizations.
a Electrostatic potential (ESP) maps of DME, DMP and TFDMP solvents with front and back views, color scheme: yellow, F; red, O; gray, C; white, H. b 17O NMR spectra (323 K) of different electrolytes using 1 M LiCl-D2O as a standard (0 ppm) for calibration. c Raman spectra of different solvents and electrolytes obtained using 785 nm laser at 25 ± 1 °C. d FTIR spectra of different solvents and electrolytes at 25 ± 1 °C.

