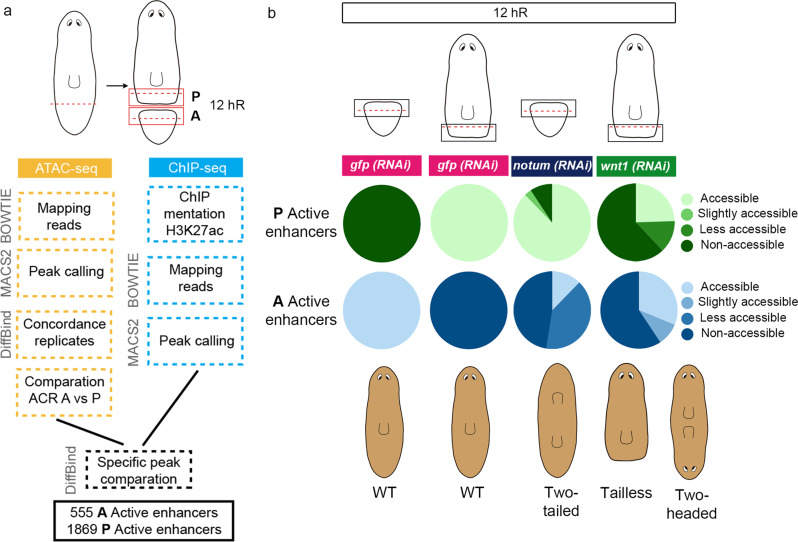
Fig. 1. The chromatin of cells in the wound remodels according to the polarity of the pre-existing tissue.
a Workflow to identify putative anterior and posterior specific enhancers at 12 hR. Next to each step the program used is indicated. b Accessibility changes of the putative anterior and posterior specific active enhancers after notum and wnt1 inhibition at 12 hR are represented in percentages in pie charts. Schematic illustration shows the representative phenotypes observed after each gene inhibition. hR, hour of regeneration. All the data is provided in Supplementary Data 1.

