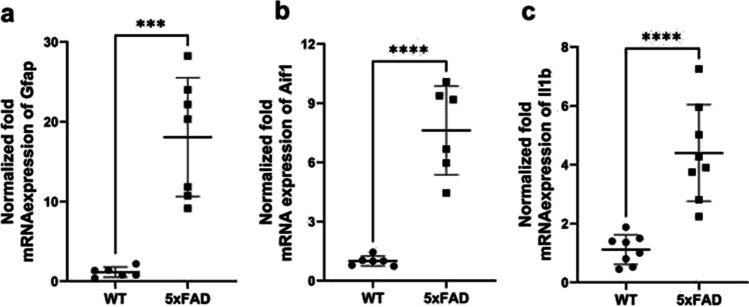
Fig. 1.
Normalized fold mRNA expression of inflammation markers, such as a glial fibrillary acidic protein (Gfap); b allograft inflammatory factor 1 (Aif1); c interleukin-1 beta (Il1b) in the brain prefrontal cortices of 5xFAD mice (n = 7) and wild-type (WT) control mice (n = 6). The normalization of gene expression was performed against the housekeeping gene glyceraldehyde‐3‐phosphate dehydrogenase (Gapdh). The data are expressed as mean ± SD. Asterisks denote a statistically significant difference from the respective control (***p < 0.005, **** < 0.001, unpaired t-test)

