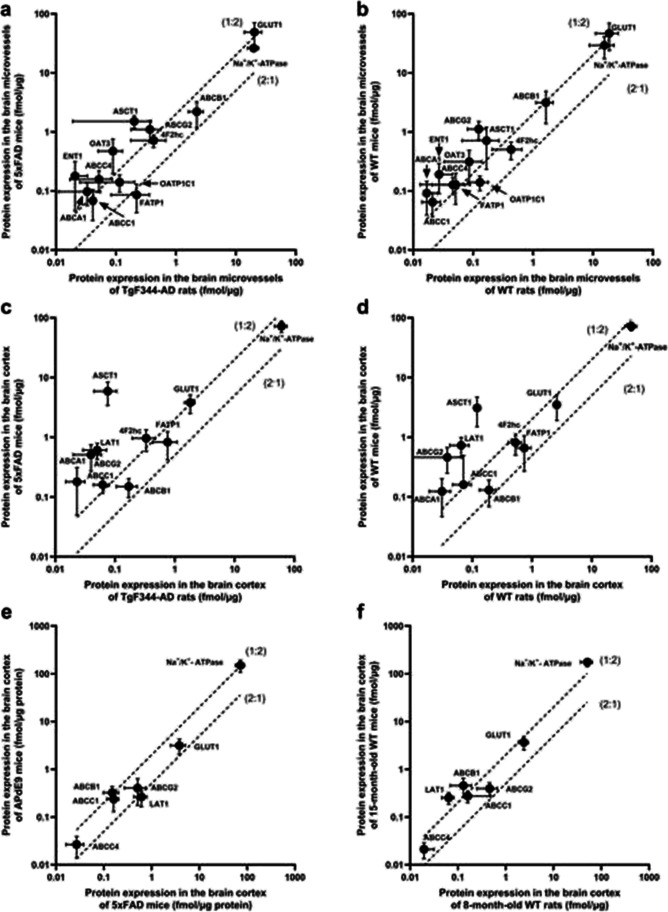
Fig. 2.
Comparison of absolute protein expression levels of the transporters in the crude membrane fraction of a isolated brain microvessels of TgF344-AD rats (n = 6) [28] versus 5xFAD mice from the present study (n = 6); b isolated brain microvessels of WT rats (n = 6) [28] versus 8-month-old WT mice from the present study (n = 6); c the brain cortices of TgF344-AD rats (n = 8) [28] versus 5xFAD mice from the present study (n = 12); d the brain cortices of WT rats (n = 5) [28] versus 8-month-old WT mice from the present study (n = 14); e the brain cortices of female APdE9 mice (n = 4) [29] versus female 5xFAD mice from the present study (n = 12); f the brain cortices of female 8-month-old WT mice (n = 5) from the present study versus female 16–17-month-old WT mice (n = 14) [29]. The top and bottom dashed lines represent a twofold higher or lower protein expression, respectively, between the studied groups. Data are expressed as mean ± SD

