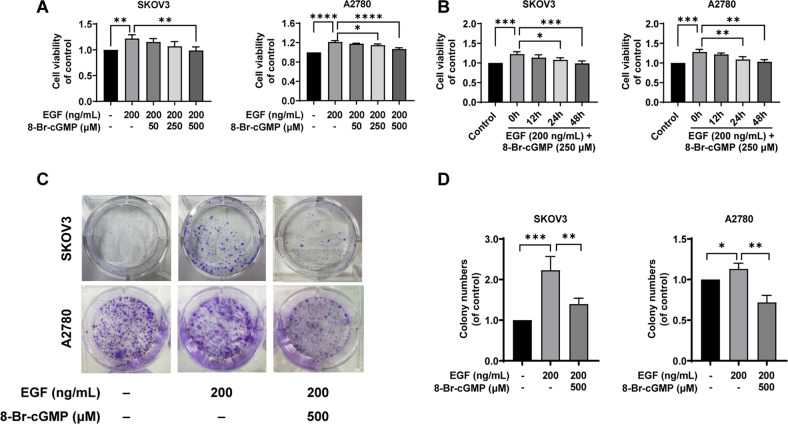
Fig. 2. Activation of PKG I attenuated EGF-induced EOC cell proliferation in vitro.
A, B EOC cell proliferation was analyzed by CCK8 assays. C, D R Representative results of colony formation; the number of colonies counted was of an entire well and the error bars represent mean ± SD from three independent experiments. Significance was evaluated Ordinary two-way ANOVA analysis followed by Tukey’s multiple comparisons test in (A, B, D). *p < 0.05; **p < 0.01; ***p < 0.001; ****p < 0.0001 under indicated comparison.

