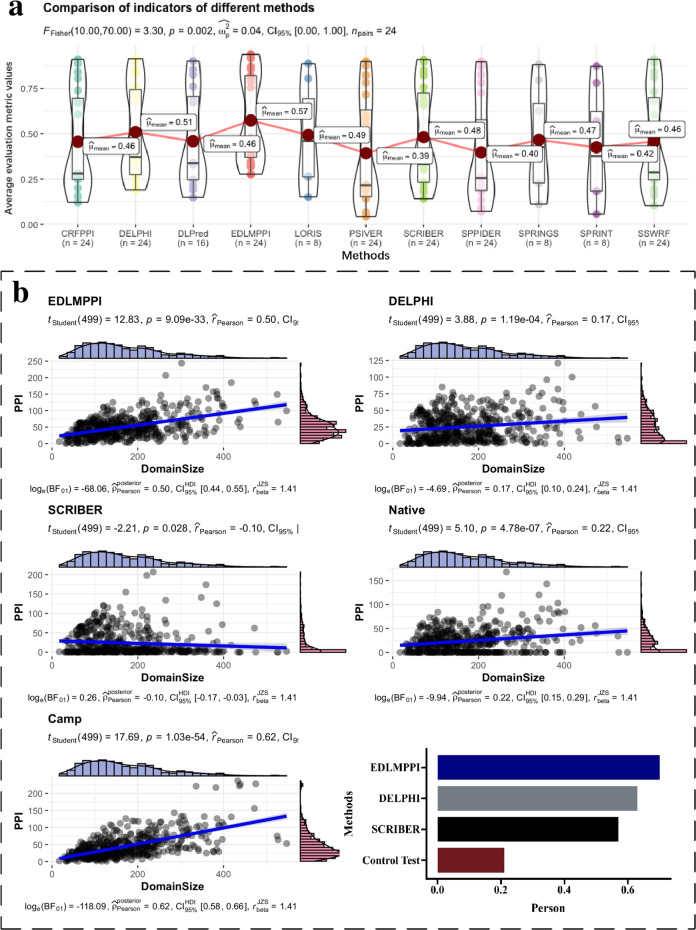
Fig. 3. Display of the results of comparative experiments and biological analysis experiments.
a Demonstrating the results of comparisons between EDLMPPI and ten other competitive methods, with the “Average evaluation metric values” referring to the average of the eight evaluation metrics (including TPR, TNR, Pre, ACC, F1, MCC, AUROC, and AP) for the different methods on these three datasets. b A comparison of the predicted PPIs from EDLMPPI, DELPHI, and SCRIBER compared to native PPIs. By calculating the proportion of PPIs in each domain, EDLMPPI and native PPIs have the highest correlation.

