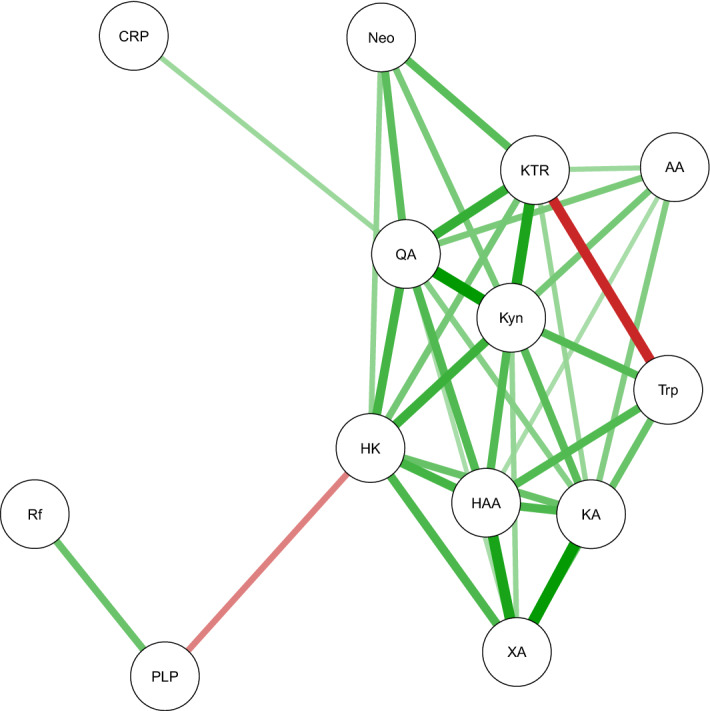
Figure 2.

Qgraph plot of spearman correlations (including only absolute values > 0.2 to avoid a crowded figure) adjusted for cohort, sex, age, BMI, creatinine, cotinine and sample storage time. Green lines show positive correlations, red lines show inverse correlations. The color saturation and thickness of lines are proportional to the strength of the correlations. The figure illustrates the data given in Supplementary Table S2. AA: anthranilic acid; CRP: C-reactive protein; HAA: 3-hydroxyanthranilic acid; HK: 3-hydroxykynurenine; KA: kynurenic acid; KTR: kynurenine/tryptophan ratio; Kyn: kynurenine; Neo: neopterin; PLP: pyridoxal 5′-phosphate; Rf: riboflavin; Trp: tryptophan; QA: quinolinic acid; XA: xanthurenic acid.
