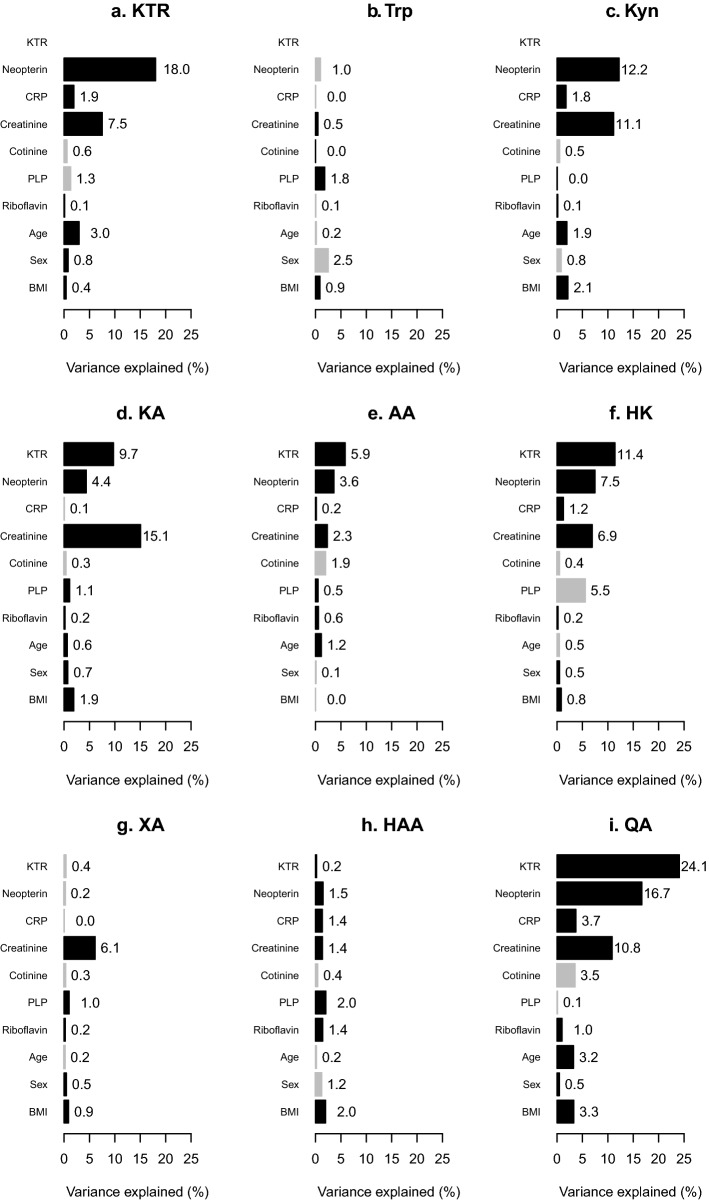
Figure 3.
Relative importance of predictors of kynurenines. The percentage of variance of tryptophan and kynurenines explained by regression models using relaimpo. All continuous variables were log-transformed and then centered on the mean and standardized by dividing by the standard deviation. Black bars are used for predictors that showed positive regression coefficients in the mixed models (Table 2), those with negative coefficients are shown in grey. KTR and neopterin were included in separate models, and the models were adjusted for cohorts. AA: anthranilic acid; BMI: body mass index; CRP: C-reactive protein; HAA: 3-hydroxyanthranilic acid; HK: 3-hydroxykynurenine; KA: kynurenic acid; KTR: kynurenine/tryptophan ratio; PLP: pyridoxal 5′-phosphate; QA: quinolinic acid; XA: xanthurenic acid.

