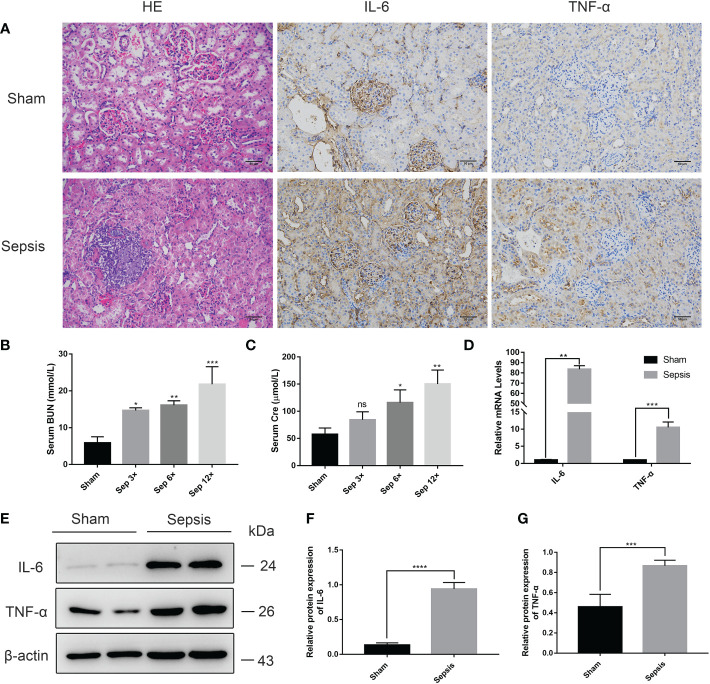
Figure 6.
Kidney injury in the rat model of urinary sepsis (A) Representative images of hematoxylin and eosin (H&E) staining of kidney tissue from the sham and sepsis groups, immunohistochemical analysis of IL-6 and TNF-α in kidney tissue (magnification, 200×; bar, 50 μm). (B, C) Serum BUN and Cre levels in rats 24 hours after E. coli or saline inoculation of the renal pelvis. (D) The relative mRNA levels of IL-6 and TNF-α in kidney tissue. (E) Expressions of IL-6 and TNF-α in kidney tissue were tested by western blot, and β-actin was used as a loading control. (F, G) Quantitative data of the levels of IL-6 and TNF-α. The sep 6× group was selected as a representative of the sepsis groups. Values were shown as mean ± SD. *P < 0.05, **P < 0.01, ***P <0.001, and ****P < 0.0001 vs sham group. "ns" means "not signifcant".

