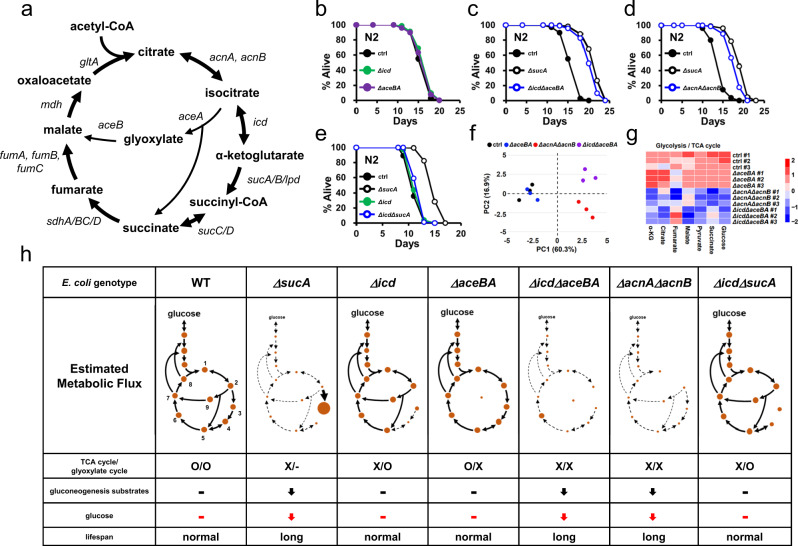
Fig. 2. E. coli mutants simultaneously impaired in TCA and glyoxylate cycle prolong the longevity of C. elegans.
a The TCA and glyoxylate cycles in E. coli. Metabolites are indicated in bold and genes encoding metabolic enzymes are indicated in italic. b–e Lifespan showing the effects of E. coli TCA and (or) glyoxylate cycle mutations on C. elegans longevity. Neither Δicd nor ΔaceBA E. coli mutants affect lifespan (b) while ΔicdΔaceBA E. coli triple mutants extend lifespan (c). ΔacnAΔacnB E. coli double mutants extended lifespan (d). Δicd mutation abolished lifespan extension by ΔsucA E. coli mutants (e). Results from representative experiments are shown with additional repeats. f PCA analysis of metabolites from control, ΔaceBA, ΔicdΔaceBA, and ΔacnAΔacnB E. coli. Metabolites from three biological repeats are analyzed using 1H-NMR. PC1 and PC2 indicate principal component 1 and principal component 2. Each point represents an independent biological sample. g Heat map analysis of metabolite quantification data. The row represents the sample and the column represents metabolite. Metabolites significantly decreased are displayed in blue, whereas metabolites significantly increased are displayed in red. The brightness of each color corresponds to the magnitude of the difference when compared with average values. For total metabolites data, see also Supplementary Table 3. h The estimated metabolic fluxes of gluconeogenesis, TCA, and glyoxylate cycles in E. coli mutants. The thickness of lines corresponds to the magnitude of metabolic fluxes. The dotted line represents weak metabolic flux. Circle size represents the level of metabolic intermediates. Numbers indicate citrate (1), isocitrate (2), αKG (3), succinyl-CoA (4), succinate (5), fumarate (6), malate (7), oxaloacetate (8), and glyoxylate (9) in WT panel. The effects on C. elegans lifespan are also indicated. Source data are provided as a Source Data file.

