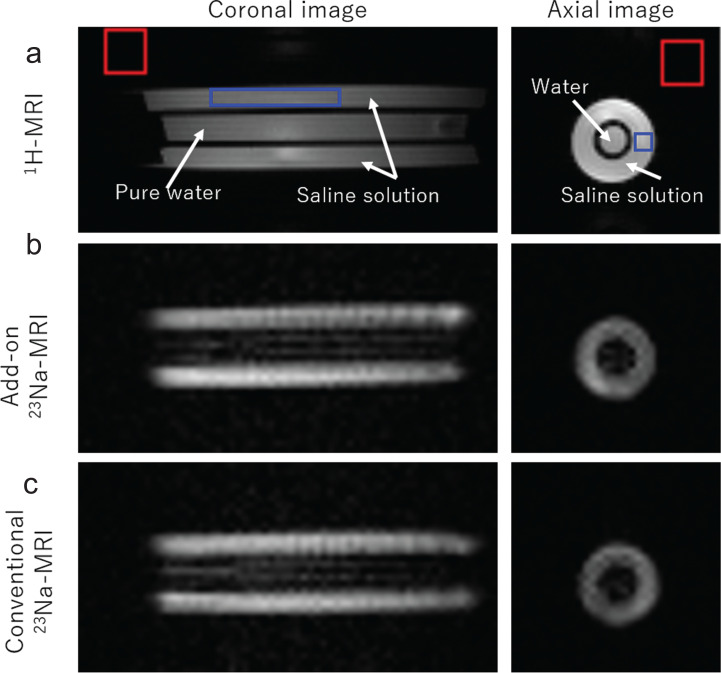
Fig. 8.
1H-and 23Na-MR images of the phantom. (a) 1H-MR images. (b) 23Na-MR images acquired with the add-on system. (c) 23Na-MR images acquired with the conventional 23Na-MRI system. The red and blue squares indicate the areas used for estimating the noise and signal levels.

