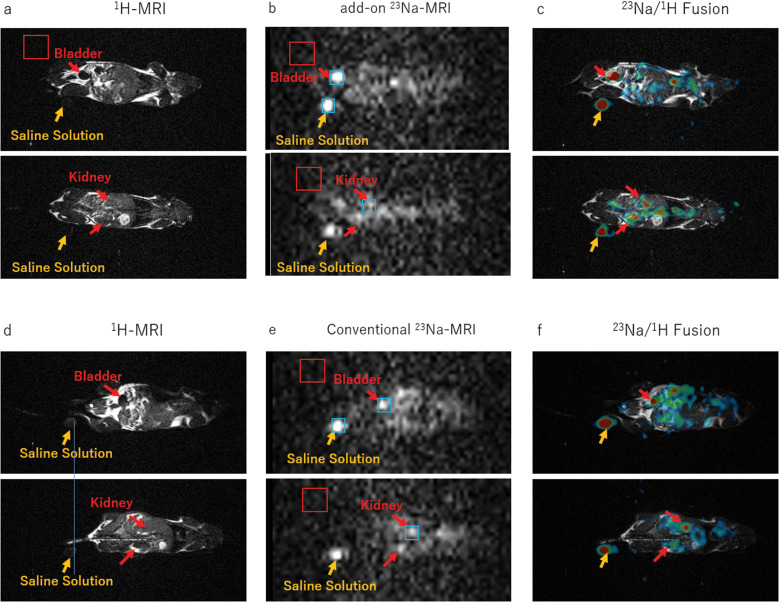
Fig. 9.
1H- and 23Na-MR images of the live mouse. (a) 1H-MR images acquired with the 1H-MRI system. (b) 23Na-MR images acquired with the add-on system. (c) Fusion images of (a) and (b). (d) 1H-MR images acquired with the 1H-MRI system. (e) 23Na-MR images acquired with the conventional 23Na system. (f) Fusion images of (d) and (e). The red and blue squares indicate the areas used for estimating the noise and signal levels, respectively.

