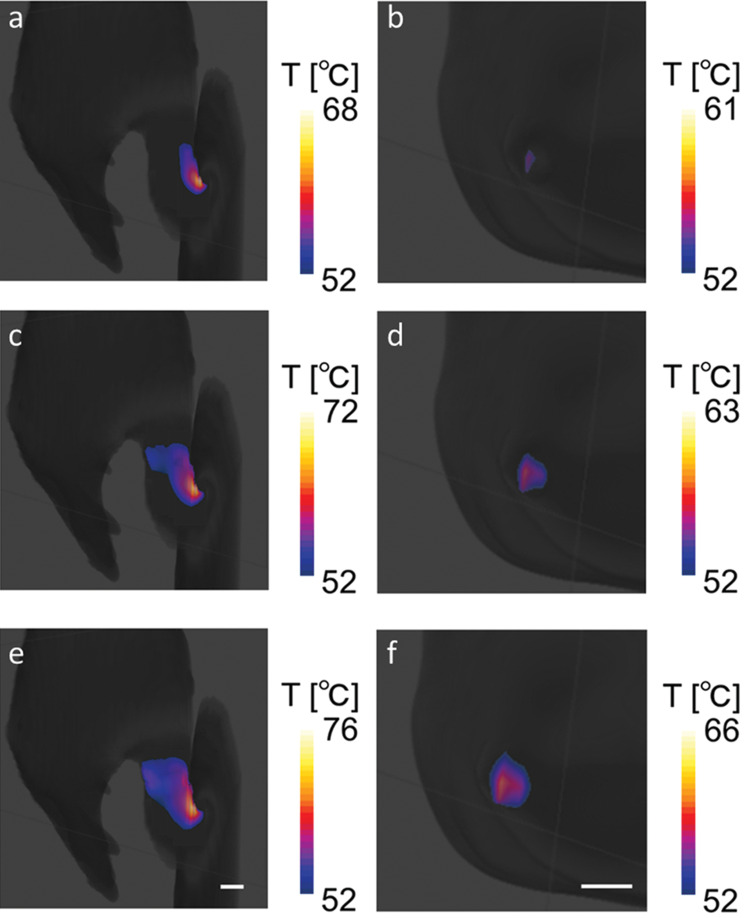
Fig. 4.
Maps of the skin surface temperature at (a and b) 3 min, (c and d) 4 min, and (e and f) 5 min for the thumb–thigh (a, c, and e) and elbow–bore wall (b, d, and f) contact cases. Temperatures above 52°C—the minimum temperature associated with a burn injury within 1 min of exposure—are mapped. The scale bar represents 10 mm. The maximum value of each color index is the maximum temperature of each mapped area (for visibility). Reproduced with permission from reference 154.

