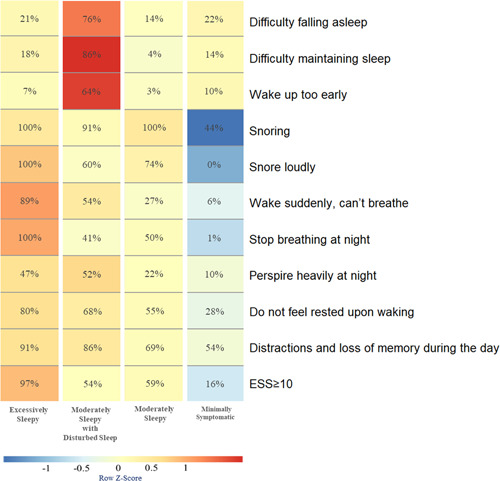
Figure 1.

Symptom profile of the identified OSA clinical subtypes. The relative differences in symptom burden among subtypes are shown by the color scale, which represents the standardized (z‐score) symptom proportion or ESS ≥ 10 across groups. Brighter red indicates a higher relative symptom burden. ESS, Epworth Sleepiness Scale; OSA, obstructive sleep apnea.
