Figure 1.

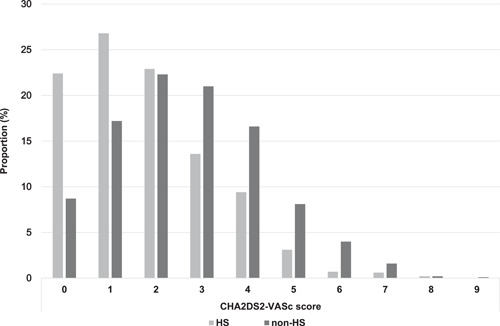
Proportion of CHA2DS2‐VASc score in the HS and non‐HS groups. The HS group (indicated by gray bars) has lower CHA2DS2‐VASc scores than the non‐HS group (indicated by black bars). HS, health screening.

Proportion of CHA2DS2‐VASc score in the HS and non‐HS groups. The HS group (indicated by gray bars) has lower CHA2DS2‐VASc scores than the non‐HS group (indicated by black bars). HS, health screening.