
Figure 3.
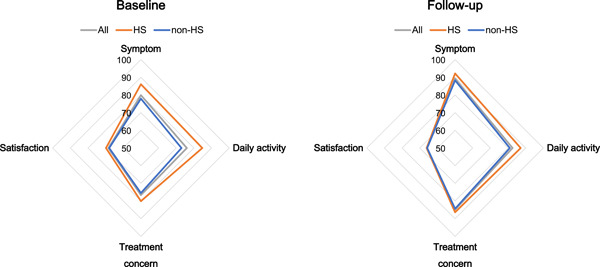
Differences in QoL scores between the HS and non‐HS groups both at baseline and follow‐up. The HS group has significantly higher QoL scores (except for the satisfaction domain) than the non‐HS group at baseline and follow‐up. The vertices of the square indicate each domain (symptom, daily activity, treatment, and satisfaction). Gray, red, and blue lines indicate all patients, HS group, and non‐HS group, respectively. HS, health screening; QoL, quality of life.