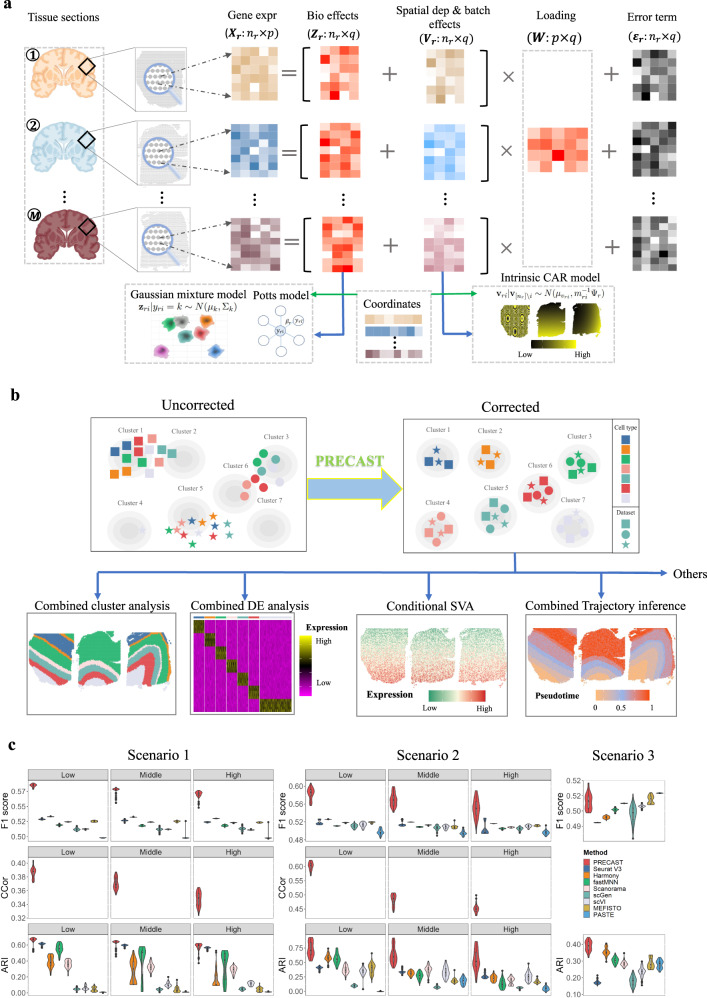
Fig. 1. Schematic overview of PRECAST and simulation results.
a PRECAST is a unified probabilistic factor model that simultaneously estimates aligned embeddings and cluster labels with consideration of spatial smoothness in both the cluster label and low-dimensional embedding spaces. Normalized gene expression matrices from multiple tissue slides are used as input. b Representative PRECAST downstream analyses. c In the simulations, we investigated two ways to generate spatial coordinates and cell/domain labels for count matrices: Potts models (scenario 1) and three cortex tissues from the DLPFC data (scenario 2). We examined the impact of scales in batch effects (low, middle, and high) on the data integration performance using scenarios 1 and 2. We also considered an additional scenario 3, which was favorable for PASTE. We evaluated performance in terms of data integration, the estimation of aligned embeddings, the estimation of slide-specific embeddings due to neighboring microenvironments, and spatial clustering (n = 11,425 spots over 50 independent replicates), using F1 scores of average silhouette coefficients (F1 score), canonical correlation coefficients (CCor), and the adjusted Rand index (ARI). ARIs displayed for the other methods were evaluated based on the results of the spatial clustering method SC-MEB. PRECAST outperformed all other data integration methods in scenarios 1 and 2, and its performance was comparable to PASTE in scenario 3. In simulations, only PRECAST estimated the slide-specific embeddings. We also evaluated the CCor with underlying truth in scenarios 1 and 2. In the boxplot, the center line, box lines, and whiskers represent the median, upper, and lower quartiles, and 1.5 times interquartile range, respectively.

