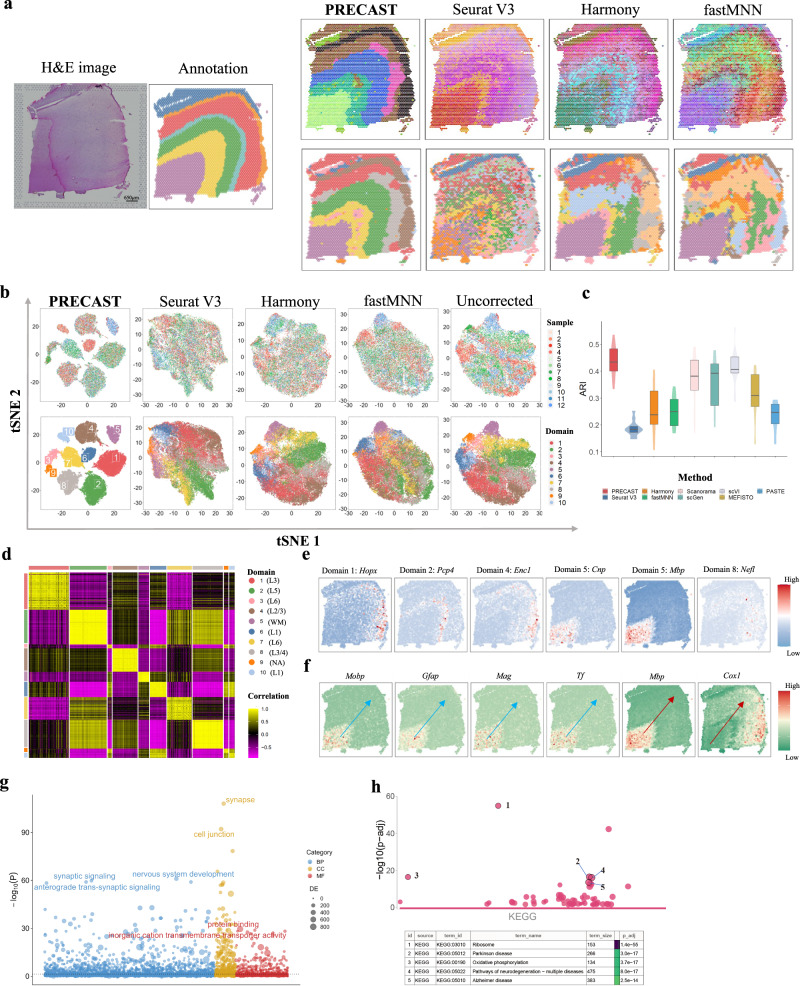
Fig. 2. Analysis of human DLPFC data (n = 47,680 locations over 12 tissue sections).
a Left panel: H& E image and manual annotation of sample ID151674. Top panel: UMAP RGB plots of sample ID151674 for PRECAST, Seurat V3, Harmony, and fastMNN. Bottom panel: Clustering assignment heatmaps for these four methods. Color scheme used in clustering assignment heatmap for PRECAST is the same with (b) and (d). b tSNE plots for these four data integration methods with right-most column showing the analysis without correction; domains are labeled as in (d). c Box/violin plot of ARI values for PRECAST and other methods; SC-MEB was used in the other methods for clustering based on their aligned embeddings. In the boxplot, the center line and box lines denote the median, upper, and lower quartiles, respectively. d Heatmap of Pearson’s correlation coefficients among detected domains. L1-L6, Layer 1–Layer 6; WM, white matter; NA, undetermined. e Spatial expression patterns of DE genes for Domain 1 (HOPX), Domain 2 (PCP4), Domain 4 (ENC1), Domain 5 (CNP), Domain 5 (MBP), and Domain 8 (NEFL) for sample ID151674. f Spatial expression patterns of genes associated with pseudotime: MOBP, GFAP, MAG, TF, MBP, and COX1, where the arrow represents the direction of the increased pseudotime. g Bubble plot of −log10(p-values) for GO enrichment analysis of genes associated with pseudotime. The p-values are based on one-sided hypergeometric tests without multiple testing adjustment. h Bubble plot of −log10(p-values) for KEGG enrichment analysis of SVGs while adjusting domain-relevant aligned embeddings by PRECAST for sample ID151674. The p-values are based on one-sided Fisher’s exact tests with the Benjamini-Hochberg FDR corrections.

