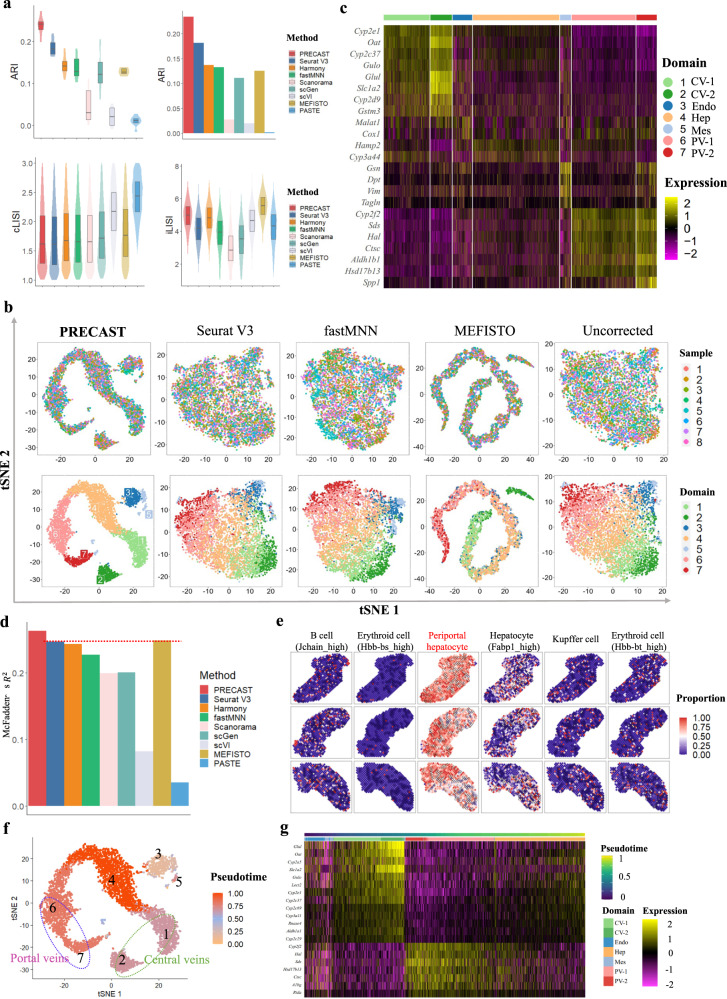
Fig. 3. Analysis of mouse liver ST data (n = 4865 locations over 8 tissue sections).
a Top panel: Box/violin plot of ARI values of each sample for PRECAST and the other methods (left); bar plot of ARI value of combined samples for PRECAST and other methods (right). Bottom panel: Box/violin plots of cLISI and iLISI values for PRECAST and other methods. Color scheme of each method is the same as in (d). In the boxplot, the center line and box lines denote the median, upper, and lower quartiles, respectively. b tSNE plots for four data integration methods, with the right-most column showing analysis without correction. Color scheme of each domain is the same as in (c) and (g). c Heatmap of differentially expressed genes for each domain identified by PRECAST. CV-1, central veins 1; CV-2, central veins 2; Endo, endothelial cells; Hep, hepcidin-related cells; Mes, mesenchymal-related cells; PV-1, portal veins 1; PV-2, portal veins 2. d Bar plot of McFadden’s adjusted R2 values for PRECAST and other methods. McFadden’s adjusted R2 measures the association between the cluster label obtained by each method and the cell proportion obtained by RCTD cell-type deconvolution, and a larger value indicates a stronger association. e Visualization of the cell type proportions mapped to spatial coordinates for six cell types of the first three samples. f Visualization of the combined trajectory inferred by PRECAST in tSNE plot of all samples. Domains 1-2 and Domains 6-7 representing central veins and portal veins, respectively, are circled. g Heatmap for genes with expression change in the Slingshot pseudotime inferred by PRECAST.

