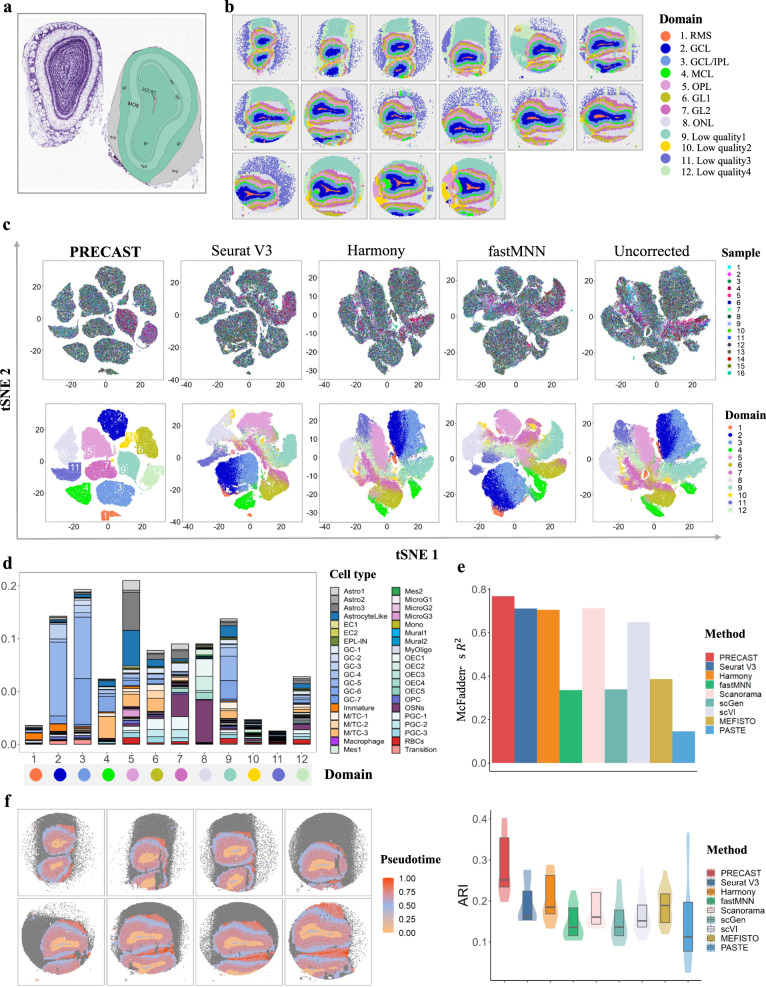
Fig. 4. Analysis of mouse olfactory bulb data (n = 594,890 locations over 16 tissue sections).
a Structure of the mouse olfactory bulb annotated using the Allen Brain Atlas. b Clustering assignment heatmaps for 16 tissue slides by PRECAST, where the first row shows samples 1–6, the second row samples 7–12, and the last row samples 13–16 (RMS, rostral migratory stream; GCL, granule cell layer; IPL, inner plexiform layer; MCL, mitral cell layer; OPL, outer plexiform layer; GL, glomerular layer; ONL, olfactory nerve layer). Color scheme for domains detected in PRECAST is as in (c) and (d), and the order of domain labels in (b) is the same as in (c), (d), and (e). c tSNE plots for four data integration methods with the right-most column showing analysis without correction. d Percentage of different cell types in each domain detected by PRECAST with scaling. e MacFadden’s adjusted R2 between the inferred cell type proportions and the estimated domain labels by PRECAST and other methods (top panel); boxplot of ARI values of 16 samples for PRECAST and other methods, where each spot is annotated using the cell type, with the highest proportion from the spatial deconvolution (bottom panel). In the boxplot, the center and box lines denote the median, upper, and lower quartiles, respectively. (f) Visualization of the trajectory inferred by PRECAST in spatial heatmap for samples 1–8.

