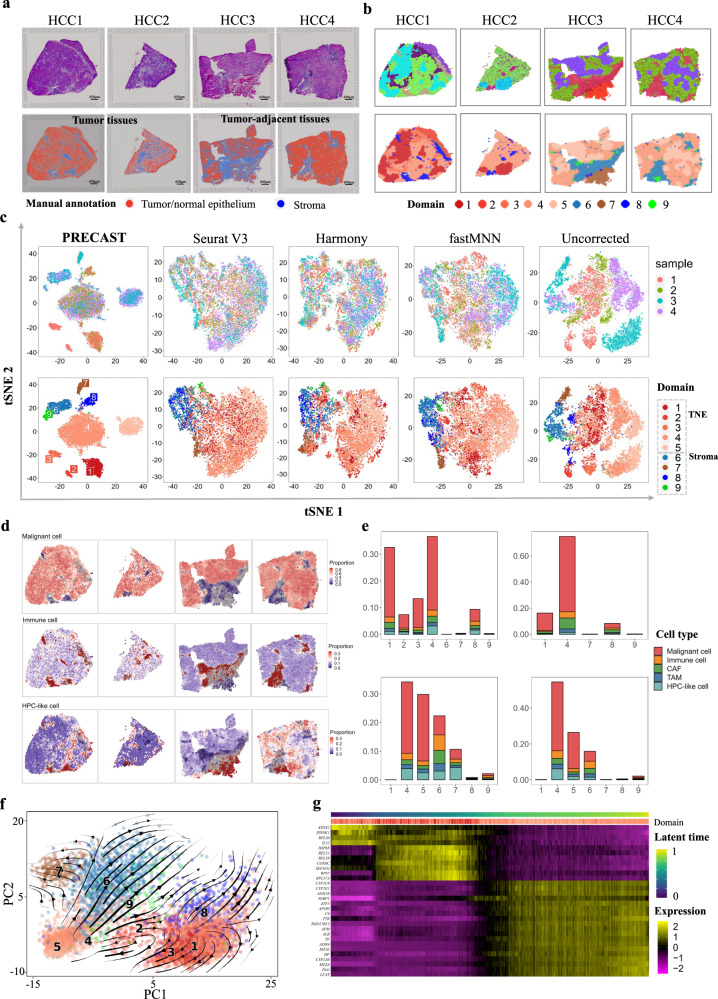
Fig. 5. Analysis of data for four human HCC sections.
a Top panel: H& E images from four tissue slides. Bottom panel: Manual annotation by a pathologist of four tissue slides. b Top panel: UMAP RGB plots of PRECAST for four tissue slides. Bottom panel: Clustering assignment heatmaps for four tissue sections by PRECAST. Color scheme for clustering assignment heatmap in PRECAST is the same as in (c), (f), and (g). c tSNE plots for four data integration methods with the right-most column showing analysis without correction; domains are labeled as in (e) and (f). TNE, tumor/normal epithelium. d Spatial heatmap of deconvoluted cell proportions in malignant cells, immune cells, and HPC-like cells. e Percentage of different cell types in each domain detected by PRECAST, with scaling to the summation of all cell types across all domains equal to 100%. f PC plot of estimated RNA velocity. g Heatmap of genes with expression change in latent time.

