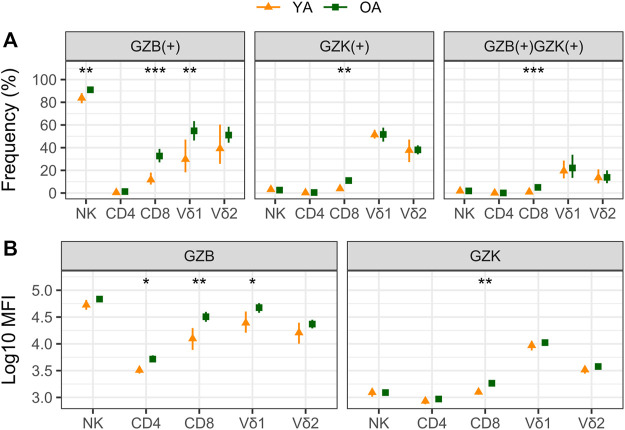
FIGURE 2.
A comparison of granzyme B (GZB) and K (GZK) expression in young (YA) and older (OA) adults. The geometric mean and 95% confidence interval for (A) the frequency of GZB, GZK or GZB/GZK-expressing cells, and (B) the mean fluorescence intensity (MFI) of GZB or GZK expression within those populations are shown, with the significance of age-related differences determined by t-test on log-transformed values. ***, p < .001; **, p < .01; *, p < .05.

