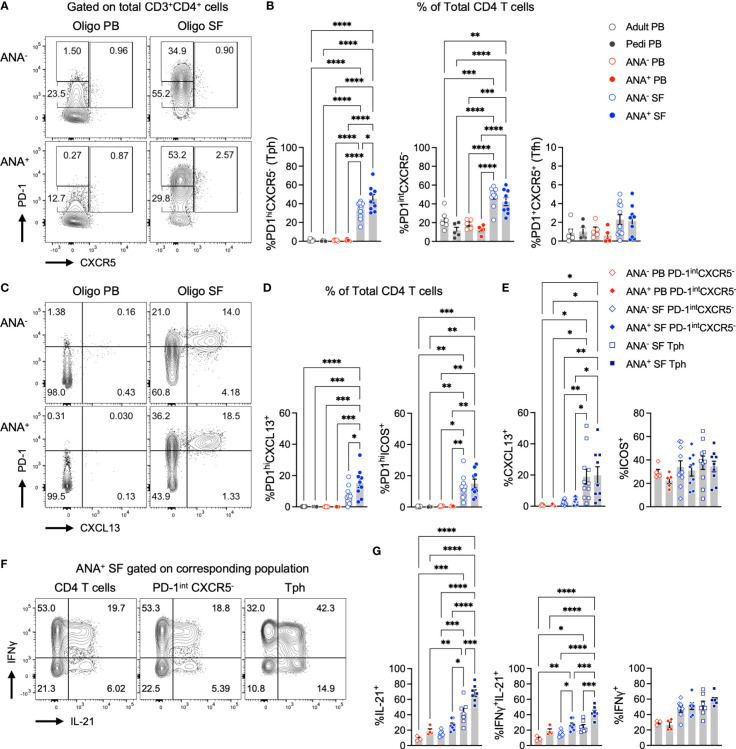
Figure 1.
T peripheral helper cells expressing B cell help factors are enriched in the synovial fluid of autoantibody-positive oligo JIA patients. (A) Representative flow staining of B cell-helper CD4+ T cell populations in oligo JIA PB and SF, gated on total CD3+CD4+ T cells. In each experiment, the PD-1hi gate was set by evaluating untstimulated PB samples from oligo JIA patients (often paired PB and SF sample from the same patient were used) and controls. This PD-1hi gate was then applied to SF samples from oligo JIA patients evaluated during the same experiment. (B) Percent of Tph (PD-1hiCXCR5-), PD-1intCXCR5+, and Tfh (PD-1+CXCR5+) cells among CD4+ T cells in the SF of oligo JIA patients (ANA-: n=11, ANA+: n=9, blue circles), and in the PB of oligo JIA patients (ANA-: n=5, ANA+: n=5, red circles) and controls (pediatric: n=5, adult: n=6, black circles). (C) Representative flow staining of PD-1hiCXCL13+ T cells in oligo JIA PB and SF, gated on total CD3+CD4+ T cells. (D) Percent of PD-1hiCXCL13+ and PD-1hiICOS+ cells among CD4+ T cells in the SF of oligo JIA patients (ANA-: n=10-11, ANA+: n=9), and in the PB of oligo JIA patients (ANA-: n=5, ANA+: n=5) and controls (pediatric: n=4-5, adult: n=6). (E) Percent of CXCL13+ and ICOS+ cells among CD4+PD-1intCXCR5- and Tph subsets in the SF (ANA-: n=10-11, ANA+: n=9) and in the PB (ANA-: n=5, ANA+: n=5) of oligo JIA patients. (F) Representative flow staining of cytokine production in oligo JIA PB and SF, gated on CD4+ T cells and subpopulations. (G) Percent of IL-21+, IFNγ+ and dual IFNγ+IL-21+ cells among CD4+PD-1intCXCR5- and Tph subsets in the SF (ANA-: n=7, ANA+: n=7) and in the PB (ANA-: n=3, ANA+: n=5) of oligo JIA patients. Oligo JIA, oligoarticular juvenile idiopathic arthritis; PB, peripheral blood; SF, synovial fluid; pedi, pediatric; ANA, antinuclear antibody; Tph, T peripheral helper cell; Tfh, T follicular helper cell. Summary data on bar graphs are mean ± standard error. P-value <0.05 (*); <0.01 (**), <0.001 (***), <0.0001 (****). Statistical testing: one-way ANOVA followed by multiple t-tests with Turkey correction.

