Figure 2.
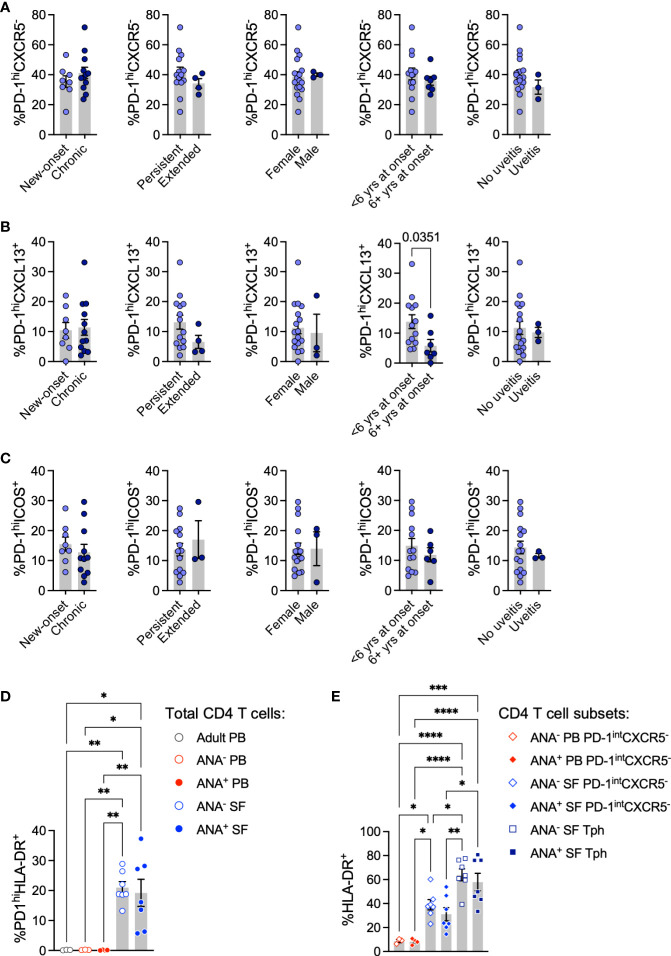
T peripheral helper cells in oligo JIA patients contrasted by disease characteristics. (A-C) Percent of Tph (CD4+PD-1hiCXCR5-, panel A), PD-1hiCXCL13+ (panel B), and PD-1hiICOS+ (C) cells among total CD4+ T cells in the SF of oligo JIA patients (n=20) with varied disease characteristics. (D) Percent of PD-1hiHLA-DR+ cells among CD4+ T cells in the SF of oligo JIA patients (ANA-: n=7, ANA+: n=7, blue circles), and in the PB of oligo JIA patients (ANA-: n=3, ANA+: n=4, red circles) and adult controls (n=3, black circle). (E) Percent of HLA-DR+ cells among CD4+PD-1intCXCR5- and Tph subsets in the SF (ANA-: n=7, ANA+: n=7) and in the PB (ANA-: n=3, ANA+: n=4) of oligo JIA patients. yrs, years; PB, peripheral blood; SF, synovial fluid; ANA, antinuclear autoantibody; Tph, T peripheral helper. Summary data on bar graphs are mean ± standard error. P-value <0.05 (*); <0.01 (**), <0.001 (***), <0.0001 (****). Statistical testing: (A-C) Two-tailed Student’s T-test; (D-E) one-way ANOVA followed by multiple t-tests with Turkey correction.

