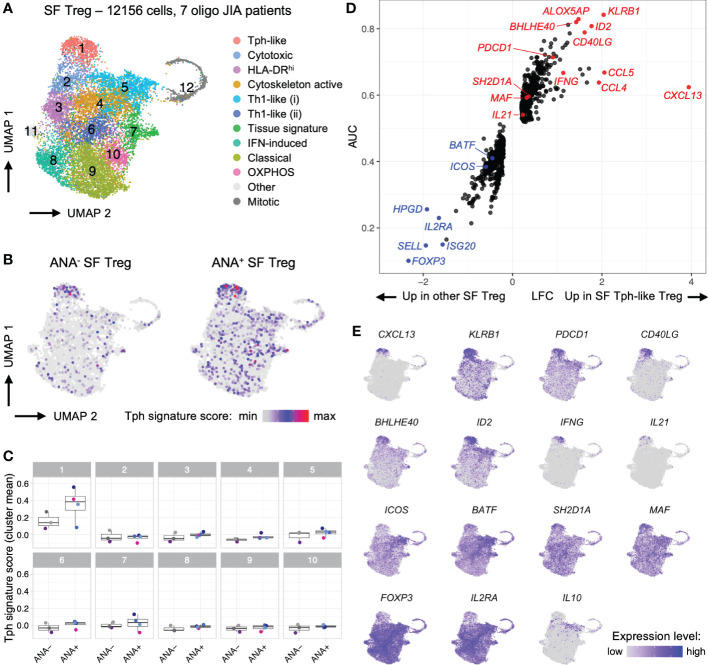
Figure 6.
T regulatory cells in oligo JIA synovial fluid adopt a distinctive transcriptomic signature characterized by robust expression of CXCL13. Combined data from two previously published datasets of oligo JIA SF Treg (CD4+CD127loCD25+) cells studied with 10X Genomics (34, 45). (A) UMAP of SF Tregs from 7 oligo JIA patients, color-coded by cluster. (B) UMAP of SF Tregs split between ANA- (4550 cells) and ANA+ (7606 cells) groups, color-coded with their Tph signature score. (C) Mean Tph signature score, averaged per patient and cluster. Multiple T-test comparisons of ANA- versus ANA+ groups revealed no significant difference after FDR correction. (D) LFC versus AUC plot of differential expression analysis of SF Tph-like Tregs (Cluster 1) versus other SF Tregs (Clusters 2-11) run with Seurat v4 using the receiving operating characteristic (ROC) approach. (E) UMAP of SF Tregs showing expression levels of selected Tph-like Treg genes in the top 95% percentile of the gene expression level distribution for each gene. Oligo JIA; oligoarticular juvenile idiopathic arthritis; SF, synovial fluid; Treg, T regulatory cell; Tph, T peripheral helper cell; ANA, antinuclear antibody; OXPHOS, oxidative phosphorylation; UMAP, uniform manifold approximation and projection; AUC, area under the curve; LFC, log2 fold change; FDR, false discovery rate.

