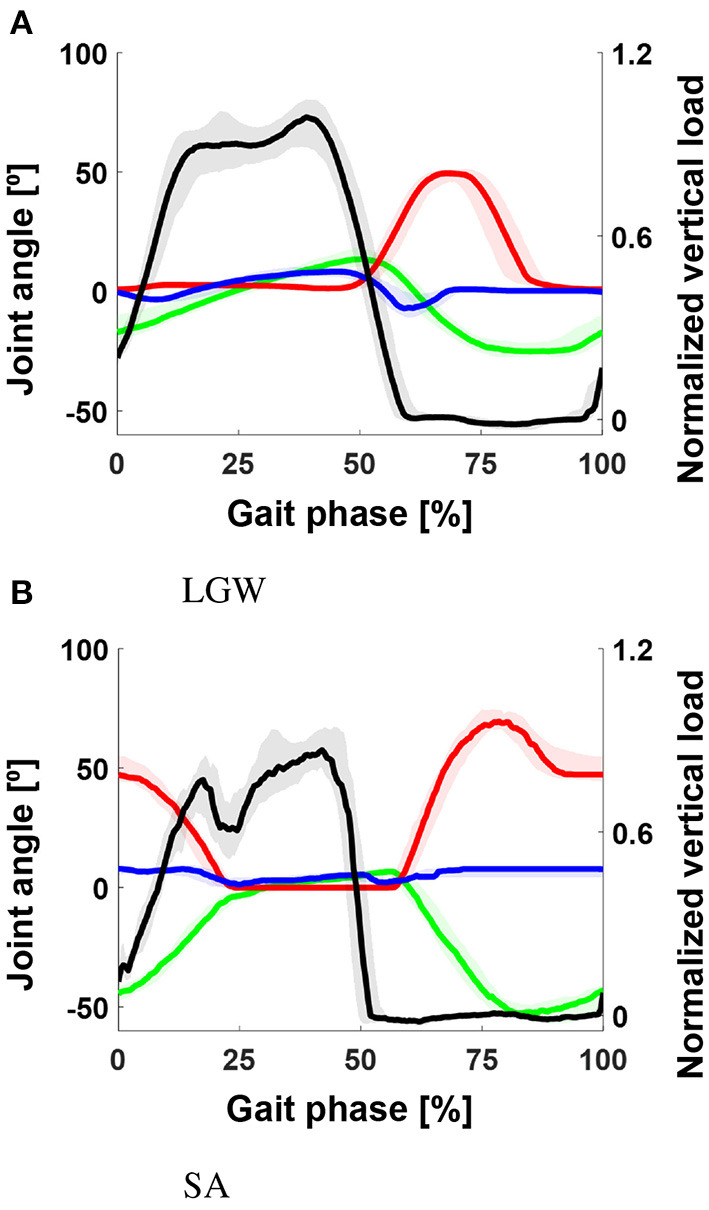
Figure 6.

Gait trajectory for LGW (A) and SA (B) from four transfemoral amputee users. The black, green, red, and blue lines indicate the vertical load and thigh, knee, and ankle angles, respectively. The ankle trajectories for SA showed a significantly low correlation with the benchmark datasets (Figure 5). All plots show the 75th and 25th percentiles in lighter bands.
