Figure 8.

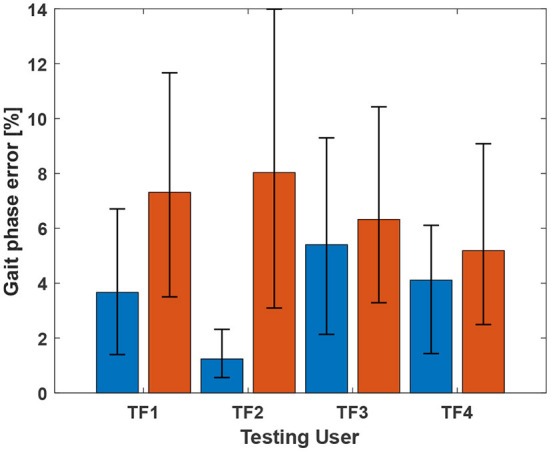
Gait phase prediction error. The blue and red bars indicate errors for LGW and SA, respectively. The average errors for LGW and SA were 4.82% and 8.06%, respectively. Error bar represents 25th and 75th percentiles.

Gait phase prediction error. The blue and red bars indicate errors for LGW and SA, respectively. The average errors for LGW and SA were 4.82% and 8.06%, respectively. Error bar represents 25th and 75th percentiles.