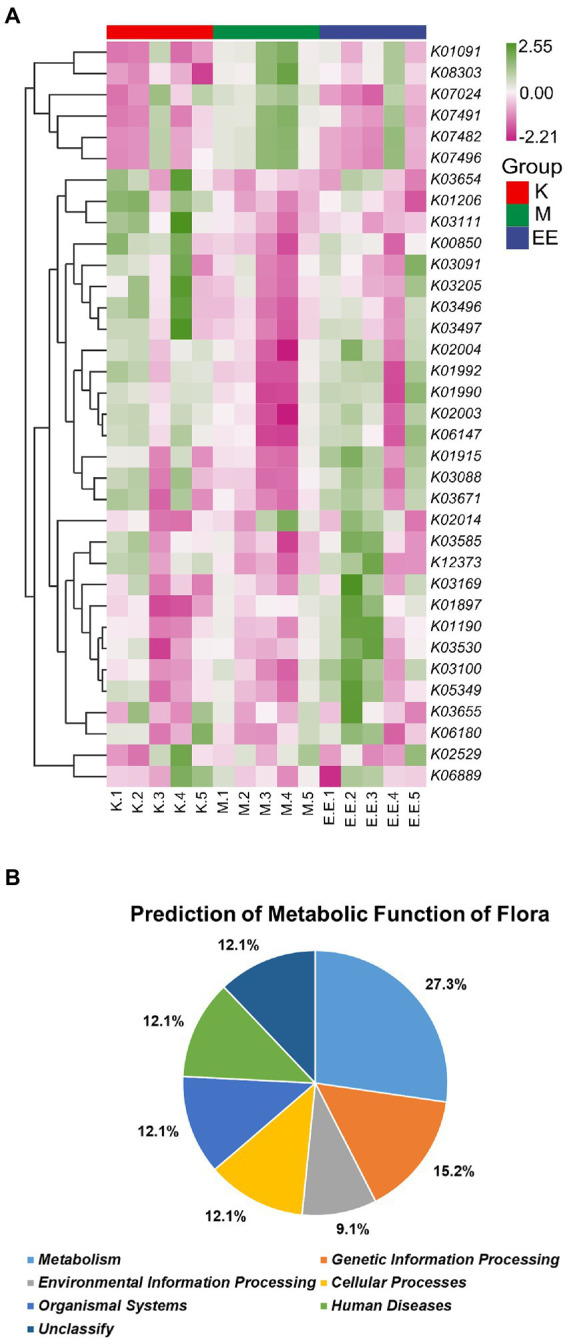
Figure 6.

Prediction of metabolic function of the microbiota. (A) Heat map of the predicted metabolic functions of the flora based on the KO database (top 35). The horizontal coordinate is the sample name and the vertical coordinate is the associated metabolic pathway number, N = 5; (B) Plot of the predicted metabolic functions of the flora as a percentage.
