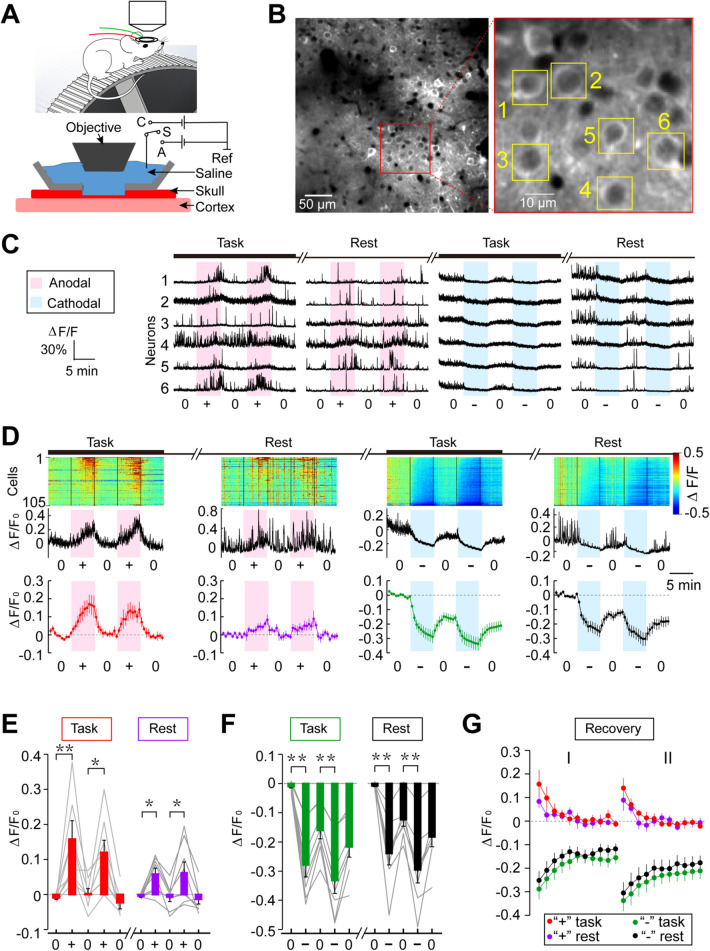
Fig. 3.
Transcranial two-photon imaging of tDCS-induced modulation of cortical neuronal activity. A Schematic depicting the optical window over the thinned skull for two-photon imaging of M1 neurons in a head-fixed mouse on a treadmill that moves at a constant speed during the task. B Example images of Thy1-GCaMP6s-expressing neurons in M1, viewed through the imaging window. Red-boxed region is shown at higher resolution on the right, revealing GCaMP6s fluorescence of individual layer II/III neurons. C Changes of GCaMP6s fluorescence (ΔF/F0) with time monitored in six M1 neurons (marked by boxes in B). Pink, duration of anodal tDCS at 25 µA; blue, duration of cathodal tDCS at 50 μA. D Fluorescence changes of all labelled cells within the image field, recorded from one mouse. Upper panel, amplitude of ΔF/F0 for each cell with time is color-coded (scale on right). The cells are ordered according to the peak values of ΔF/F0. Middle panel, average ΔF/F0 for all cells shown above, Lower panel, average ΔF/F0 for all cells from 8 mice. E, F Summary of tDCS-induced GCaMP6s fluorescence changes for data from all mice (n = 8). Average fluorescence changes (ΔF/F0) during the last 2-min of tDCS are normalized by the average values during the 2-min baseline period prior to tDCS, for two consecutive trials under task and rest conditions. Data for the same set of neurons in each mouse are connected by lines (*P < 0.05, **P < 0.01, paired t test). G Post-treatment persistence of tDCS effects shown by the average fluorescence changes with time, normalized by the values at the time of termination of anodal or cathodal tDCS, for task and rest conditions. Error bars, SEM.

