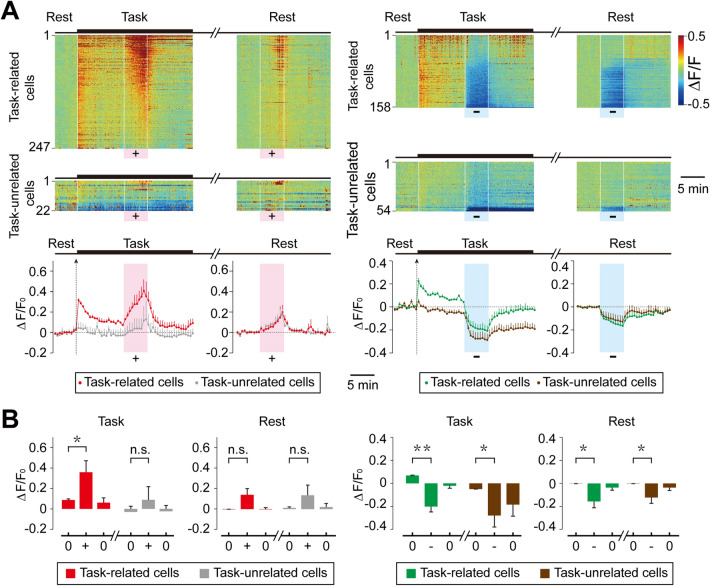
Fig. 4.
Modulation of activity of task-related and task-unrelated cortical cells by tDCS. A Fluorescence changes (ΔF/F0) of task-related cells and task-unrelated cells within the imaged field (definitions in Methods) shown by activity heat maps of M1 cell populations. Upper panels, the amplitude of ΔF/F0 is normalized for each cell by the baseline during the 5-min period before the task onset and color-coded with the scale shown on the right. All cells (anodal: n = 269; cathodal: n = 212) recorded from 4 mice are grouped and ordered according to the peak values of ΔF/F0 within the tDCS time window. Lower panels, changes in the average ΔF/F0 with time during the experiment shown above for task-related and task-unrelated cells. Error bars, SEM. B Summary of tDCS-induced ΔF/F0 for data from all 4 mice. Average ΔF/F0 during the tDCS period (“+” or “-”) were compared with those during the periods before and after tDCS (“0”). Histograms showing the average ΔF/F0 during the last 2 min of each period. Error bars, SEM; *P < 0.05, **P < 0.01, n.s. no significant difference, paired t test.

