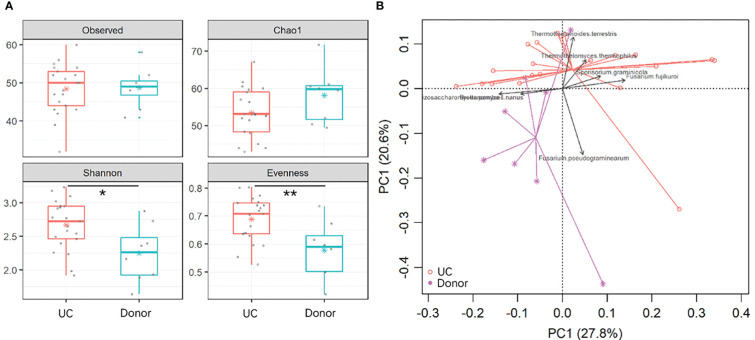
Figure 2.
Dysbiosis of gut fungal communities in UC patients. (A) α-diversity indices in UC patients and donors were analyzed, including observed OTUs, Chao 1, and Shannon and Pielou’s evenness indices. The asterisk indicated statistical differences between the two groups, *p ≤ 0.05,**p ≤ 0.01,. (B) Clusters of gut fungal communities were analyzed using PCA of the fungal species by the Euclidean distance. The top 7 species were fitted to PCA with a significance cutoff at p < 0.05.

