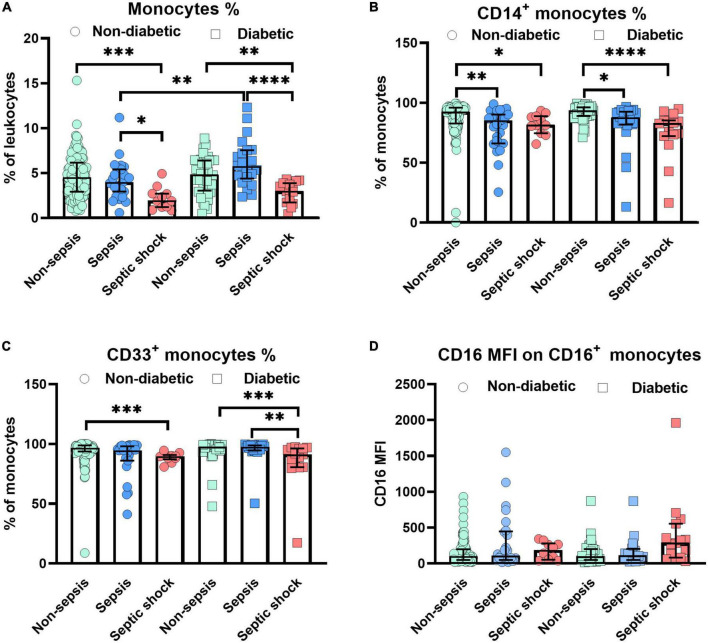
FIGURE 1.
Alterations of monocytes in non-diabetic/diabetic patients with distinct degrees of sepsis severity. Distribution changes in the percentage of monocytes among the total leukocyte population (A) and the percentage of CD14+ monocytes (B) and CD33+ monocytes among the monocyte population (C). (D) Surface phenotype expression of CD16 on positive monocytes determined by mean fluorescence intensity (MFI). Data are presented by scatter with bar plots. Results are medians with interquartile range. Kruskal–Wallis test and Mann–Whitney U-test were, respectively, used to analyze the differences among three groups and two groups. Significant difference is marked by *p < 0.05, **p < 0.01, ***p < 0.001, and ****p < 0.0001.

