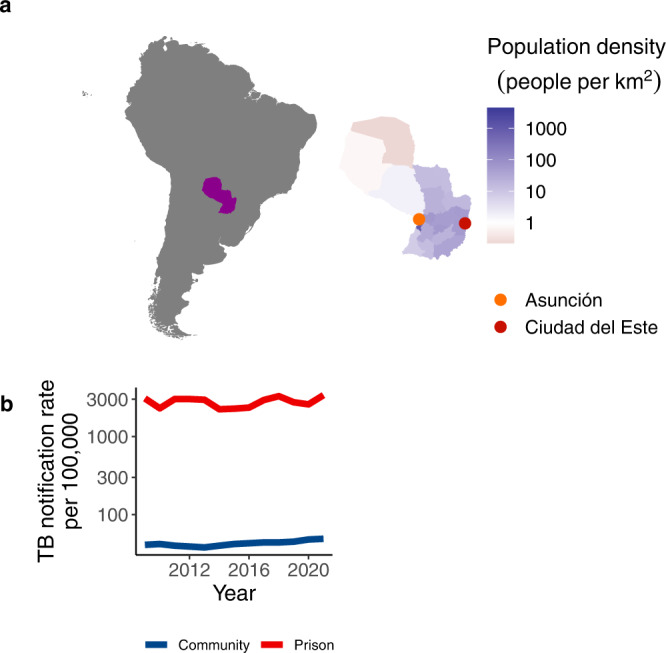
Fig. 1. Genomic surveillance within and outside prisons in Paraguay’s urban centers.

a Map of South America, with Paraguay highlighted, and as an inset. Paraguay’s departments are colored by population size density and points indicate the two largest urban centers in Paraguay, where we conducted focused genomic surveillance. b Notification rate of TB per 100,000 people in prisons (red) and in the general population (blue) from 2009 to 2020. Source data are provided as a Source Data file.
