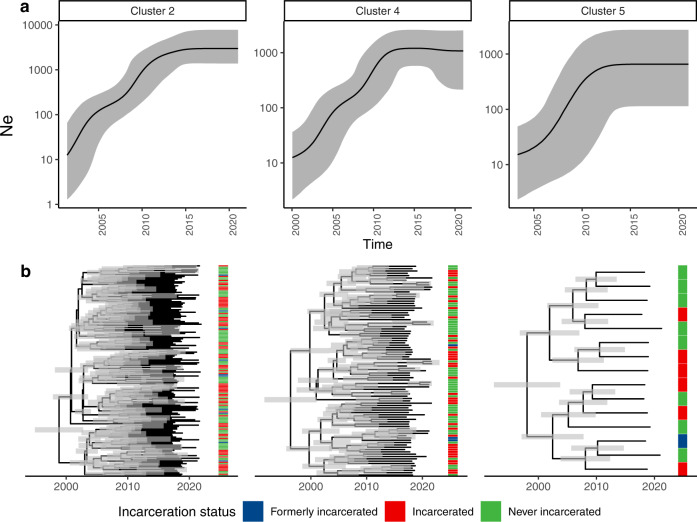
Fig. 3. Genomic transmission clusters spanning prisons and neighboring communities have recently expanded.
a Effective population size (Ne) estimates for the three largest genomic clusters in our sample over time. Black lines indicate Ne inferred in a Bayesian Skyline Coalescent model and grey shading indicates 95% high posterior density estimates. b Median clade credibility trees inferred from the Bayesian Skyline Coalescent model. Branch lengths are in years and grey bars indicate 95% high posterior density estimates of node date. The heatmap to the right of the phylogeny indicates patient incarceration status at the time of TB notification. Source data are provided as a Source Data file.

