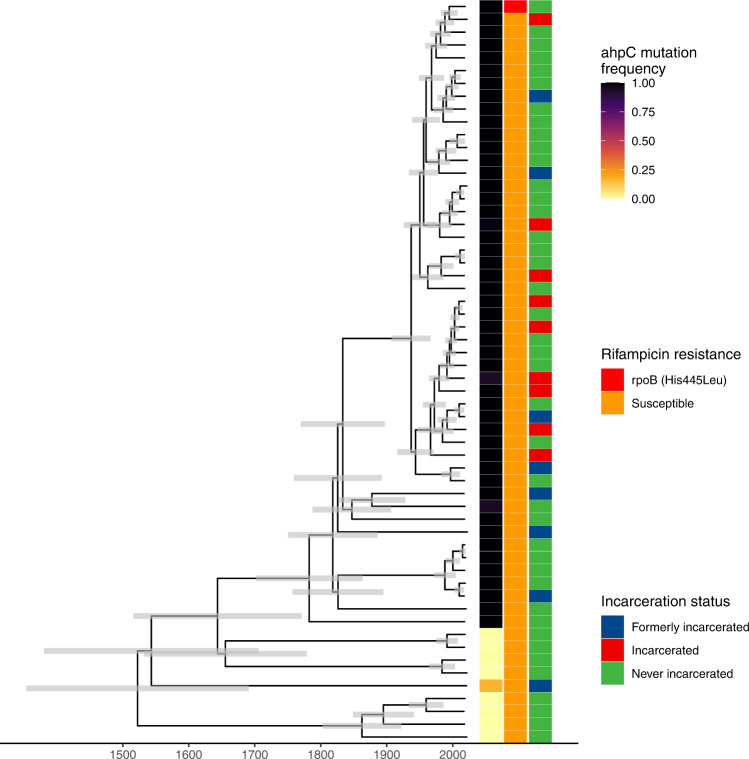
Fig. 5. Emergence of a putative resistance-associated ahpC promoter mutation.
Time-scaled Bayesian maximum clade credibility tree for 58 samples in sublineage 4.4.1.1. Branch lengths are in years and grey bars indicate 95% high posterior density estimates of node date. The heatmap to the right of the phylogeny indicates patient incarceration status at the time of TB notification, ahpC mutation frequency within an individual’s infection, and the occurrence of a rifampicin resistance-conferring mutation (rpoB His445Leu). Source data are provided as a Source Data file.

