
FIGURE 2.
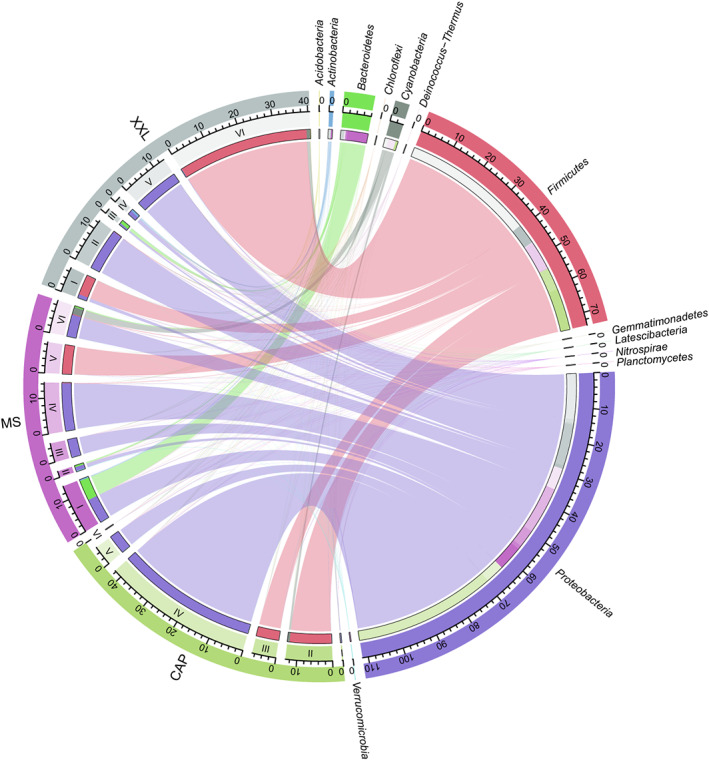
Taxonomic composition of modules in terms of relative abundance of OTUs of phyla in gut microbiome network among three populations (GPCAP, GPMS, and GPXXL). The length of the bars on the outer rings and inner rings represented the percentage and relative abundance of each module type and gut microbiome group (phylum level) in their respective sections, respectively. Each phylum was represented by a specific ribbon color, and the width of each ribbon showed the abundance of each phylum in each module type. I–VI represented the six main modules of the microbial network of three giant panda populations (GPCAP, GPMS, and GPXXL), respectively.