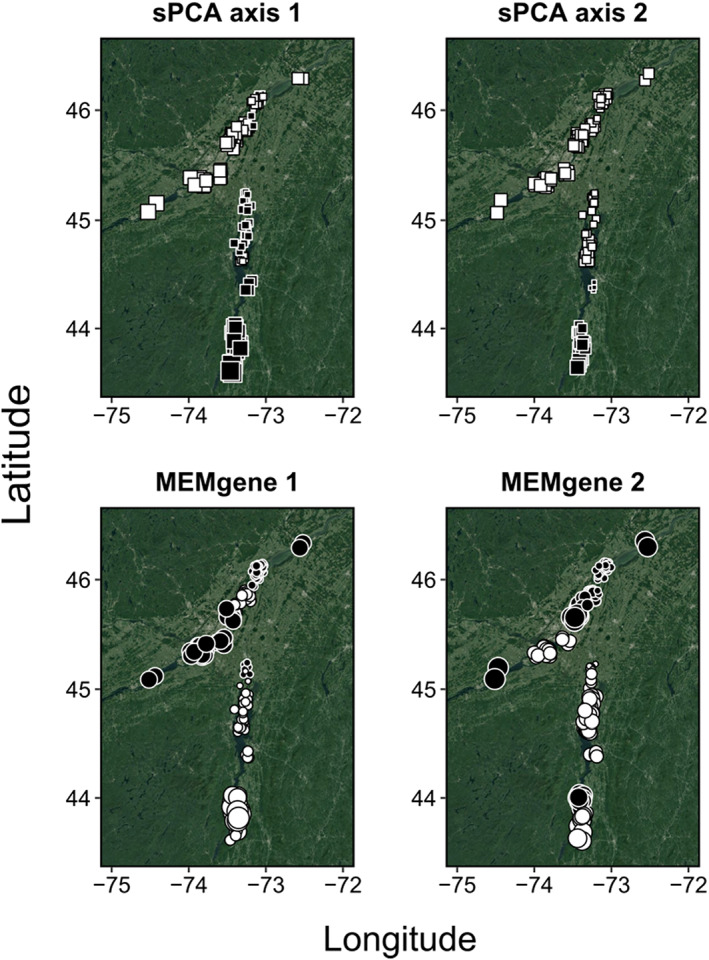
FIGURE 5.

sPCA and MEMgene highlighted contrasted patterns of population sub‐structuring of Tench (Tinca tinca) in eastern North America. Squares (sPCA) and circles (MEMgene) represent samples. To interpret the strength of genetic differentiation, square size is proportional to the eigenvalue score and colour indicates the sign: Large white square is very much differentiated from large black square, and small squares are less differentiated. To facilitate the visual interpretation of the plots, The Lake Ontario sample was removed.
