
FIGURE 2.
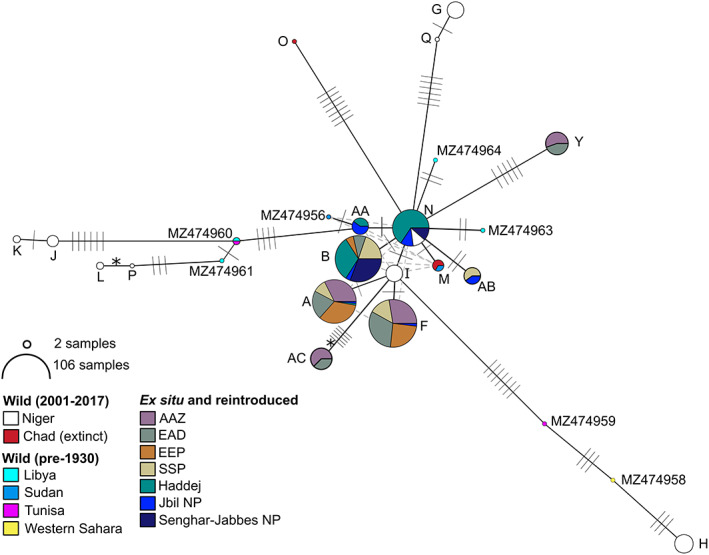
Network of addax mtDNA control region haplotypes. Circles represent haplotypes, with most likely evolutionary relationships indicated by solid black lines and alternative likely relationships shown by dashed grey lines. Mutational steps are shown by hashes. The 76‐bp indel was recoded as a single base pair 5th state and is indicated by *; all other indels were excluded. Haplotype circles are coloured according to populations as shown, with circle size indicating sample size (log scale) as indicated. Haplotype nomenclature follows Table S1. Wild (pre‐1930) haplotypes are from Hempel et al. (2021).